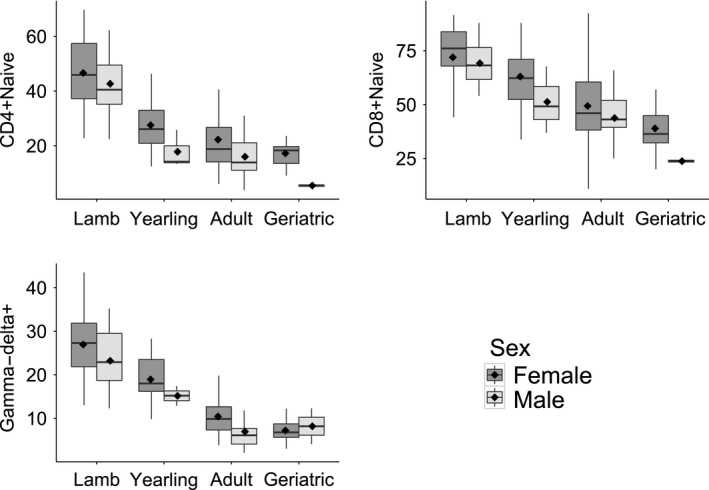
Figure 3.

Sex differences observed in three of the 11 immune parameters: naïve T cytotoxic (CD8+), naïve T helper (CD4+), and gamma–delta T cells. In all three parameters shown, females have higher proportions of each cell type than males, and this difference was found to be independent of age (see Table 3). The mean for each age‐group is represented by a diamond shape within each box and the median by a black horizontal line. The box represents the interquartile range (IQR) and the whiskers show the highest and lowest values within 1.5*IQR
