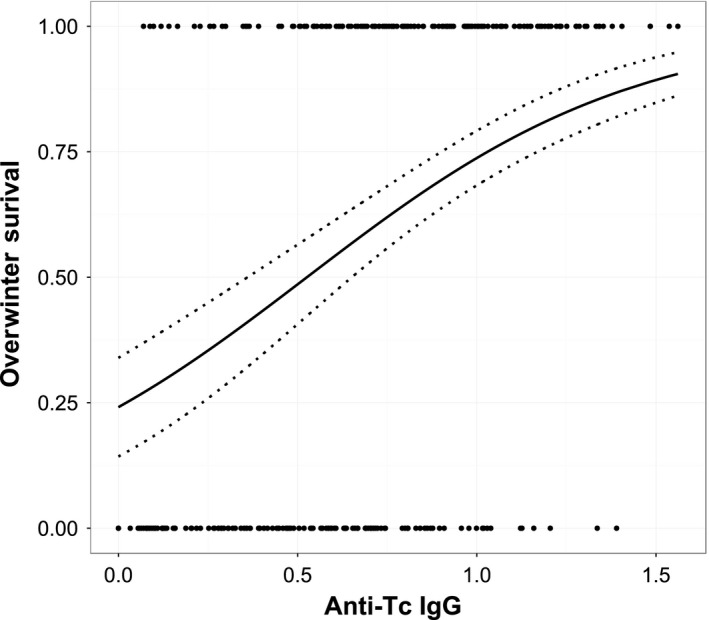
Figure 4.

A logistic regression plot of the relationship between August anti‐Teladorsagia circumcincta IgG antibody levels and subsequent overwinter survival (1 = survived, 0 = died). The points in the plots are the raw data and include all age‐groups and sexes combined. The black line is of the predicted values for adult females from the final model. The dotted lines show the standard error of these values
