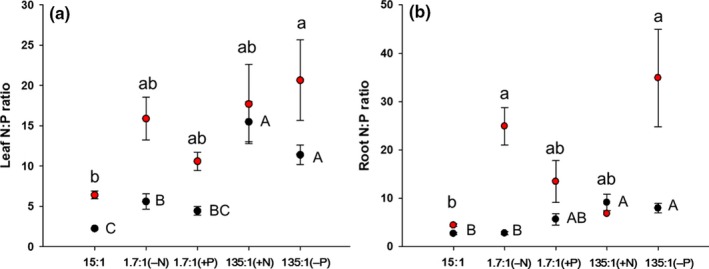
Figure 4.

Mean values (± SE) of N:P in leaf (a) and root tissue (b) of grasses (black symbols) and composite forbs (red symbols) measured in each experimental treatment after 14 weeks. The 15:1 treatment represents the balanced N:P ratio (the Control); the 1.7:1 (−N) treatment includes one‐ninth the amount of N as the Control; the 1.7:1 (+P) treatment includes nine times the amount of P as the Control; the 135:1(+N) treatment includes nine times the amount of N as the Control; the 135:1(−P) treatment includes one‐ninth the amount of P as the Control. Within each panel, means labeled with the same letter (capital letter: grasses; lower case: composite forbs) do not differ at P = .05 according to Tukey's test
