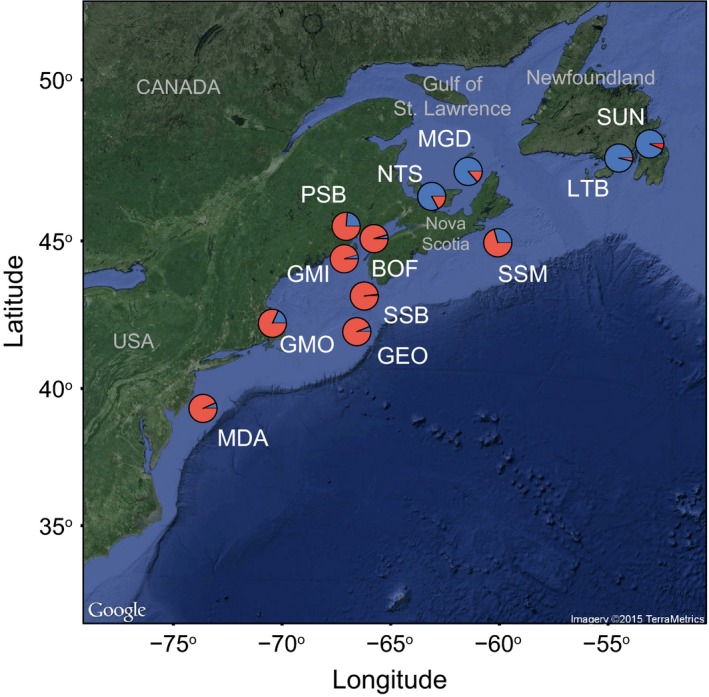
Figure 3.

Map of the proportion of each of the 12 P. magellanicus populations assigned to two population groups (blue and red) identified in the program STRUCTURE using outlier loci and the ΔK method to select the optimal number of genetic clusters in the data
