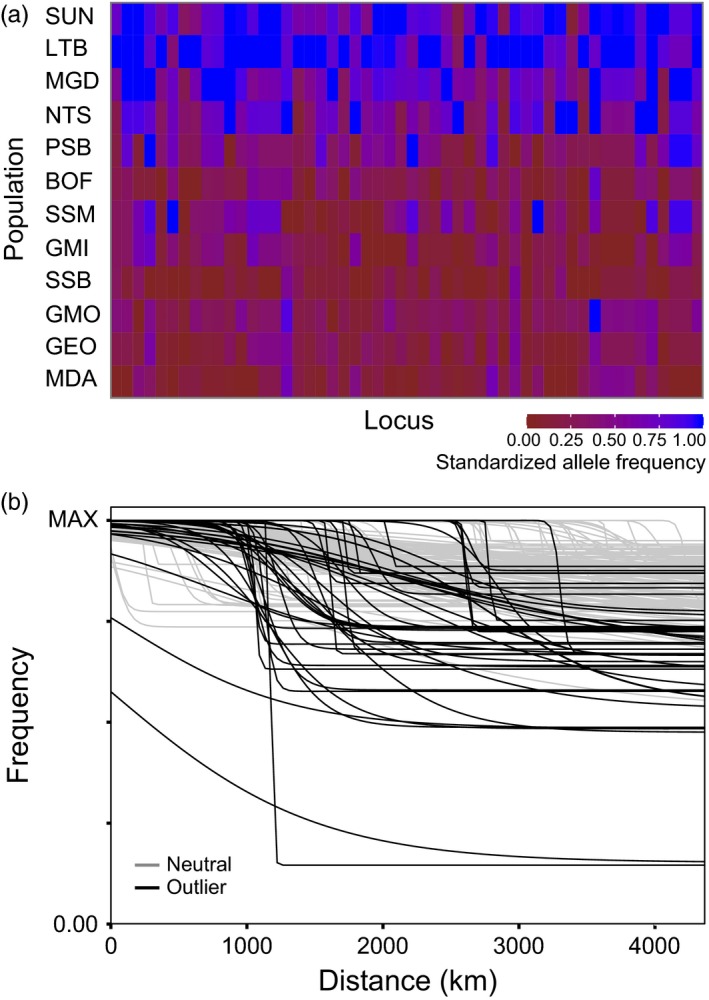
Figure 8.

(a) Heat map of population‐specific standardized allele frequencies for 48 clinal outlier loci in 12 populations of P. magellanicus. (b) Plot of clines in allele frequency in 12 populations of P. magellanicus as a function of the distance in kilometres from the furthest north population (SUN) for clinal neutral loci (n = 123, 24.6% of tested loci, grey) and clinal outlier loci (n = 48, 42.9% of tested loci, black)
