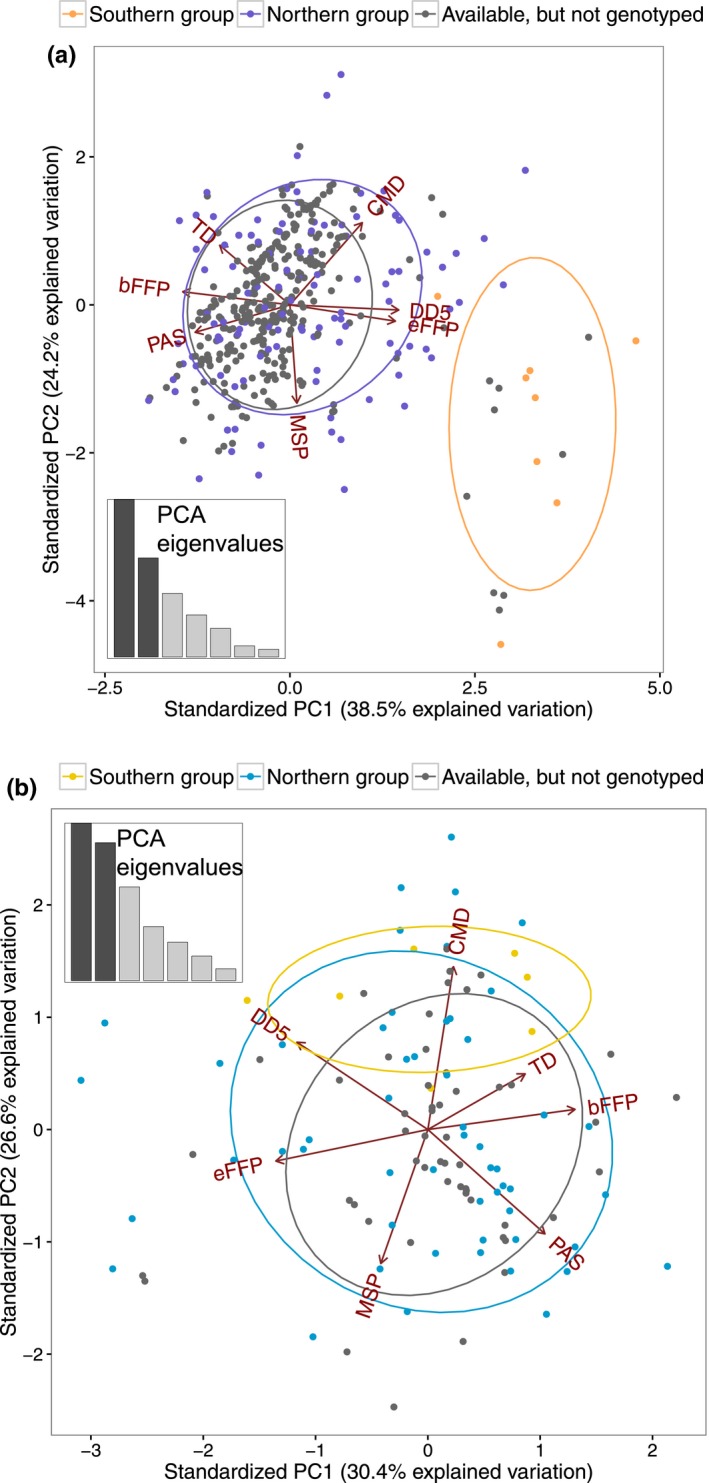
Figure 3.

(a) Pinus strobus and (b) P. monticola: principal component analysis (PCA) including seven climatic variables obtained for available samples in seed banks and provenance trials (see Nadeau et al., 2015). Variation along PC1 (x‐axis) and PC2 (y‐axis) was used to select samples for genotyping in order to cover a wide range of environmental variation. Genotyped populations are colored according to their genetic group membership as in Figure 2. Available populations that were not genotyped (gray dots) were either not sampled or failed genotyping. Ellipses represent the 95% confidence intervals for each group. Insets show the proportion of variation explained by each PC
