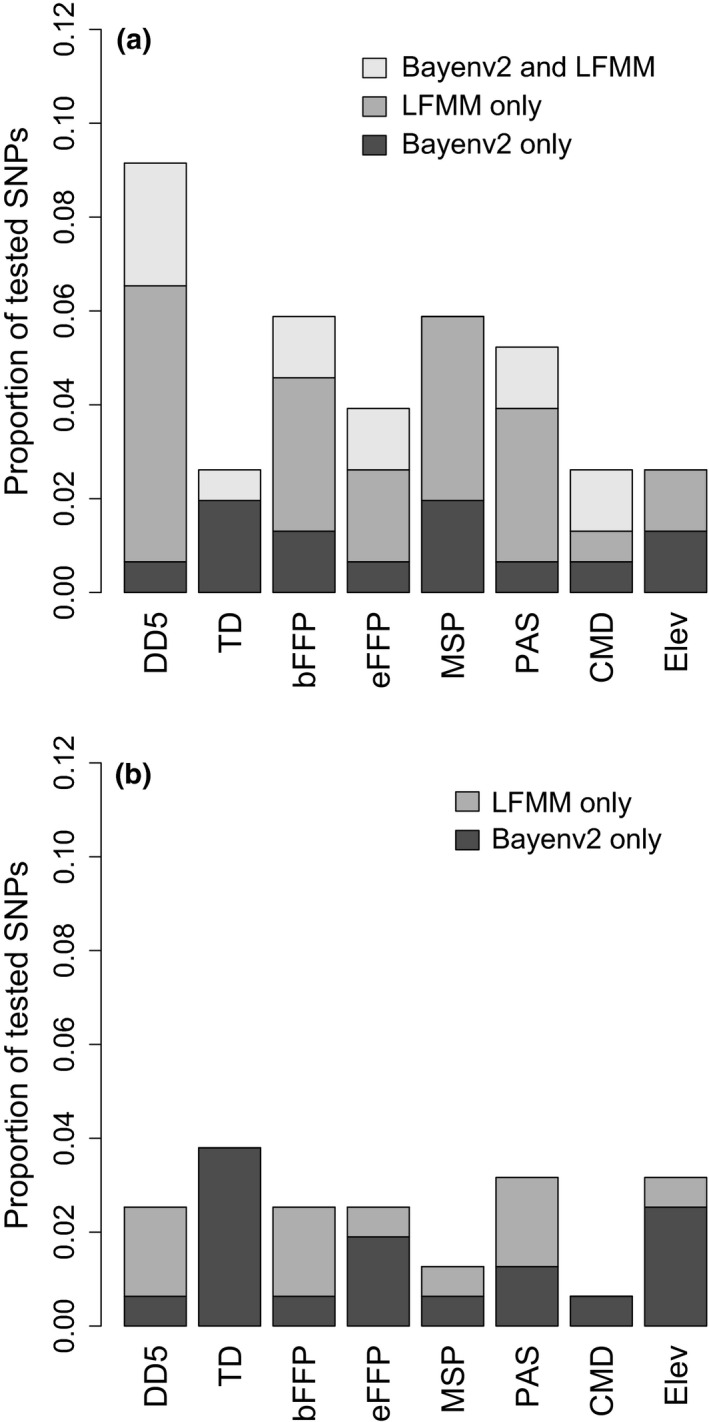
Figure 4.

(a) Pinus strobus and (b) P. monticola: proportion of tested SNPs associated with each climatic variable by Bayenv2 (Bayes factor >3) and LFMM (q < 0.05)

(a) Pinus strobus and (b) P. monticola: proportion of tested SNPs associated with each climatic variable by Bayenv2 (Bayes factor >3) and LFMM (q < 0.05)