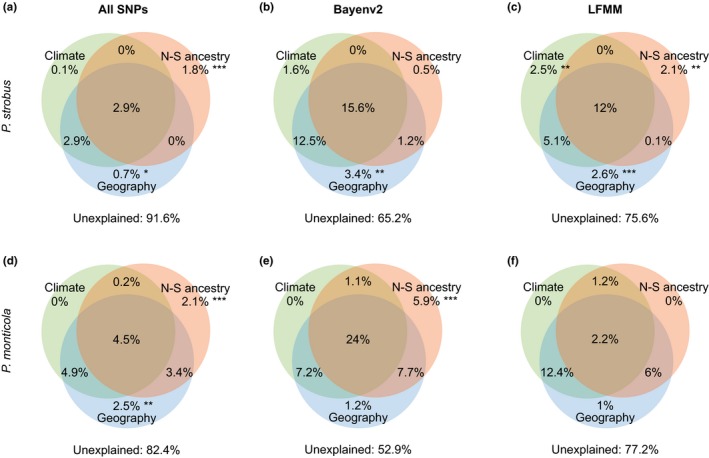
Figure 5.

(a, b, c) Pinus strobus and (d, e, f) P. monticola: Venn diagrams showing the proportion of among‐population genetic variation explained by climate (IBE, eight climatic variables), geography (IBD, P. monticola: x, y, xy, y 2; P. strobus: x, y, xy), and north–south ancestry (IBC, Q‐values from STRUCTURE) in redundancy analyses (RDAs) using (a, d) all SNPs; or subsets of SNPs detected by (b, e) Bayenv2; and (c, f) LFMM. Circles in Venn diagrams are not proportional to the amount of explained variation by each factor. Significance codes: *p < .05; **p < .01; ***p < .001. Significance of confounded fractions between climate, geography, and north–south ancestry (overlap in circles) was not tested
