Figure 4.

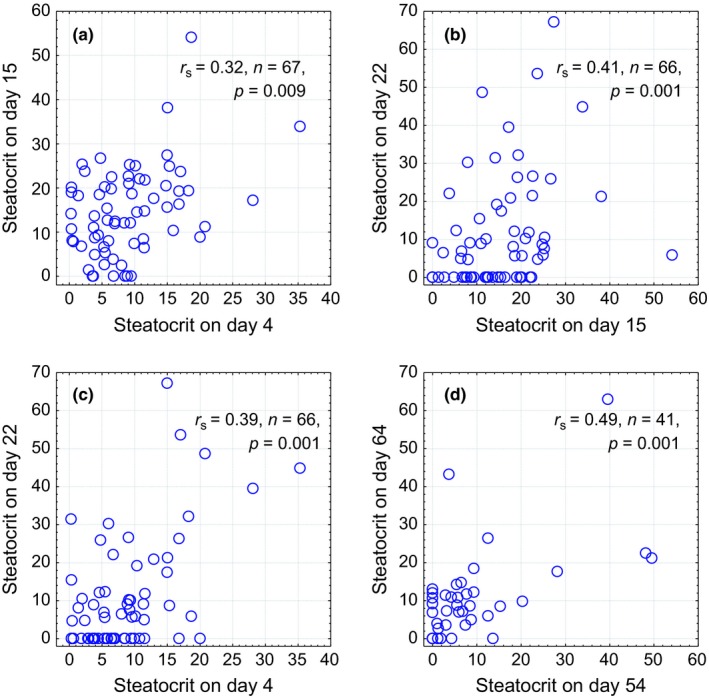
Spearman rank correlations and scatter plots between individual values of steatocrit, measured in different time points in male (a–c) and female (d) greenfinches

Spearman rank correlations and scatter plots between individual values of steatocrit, measured in different time points in male (a–c) and female (d) greenfinches