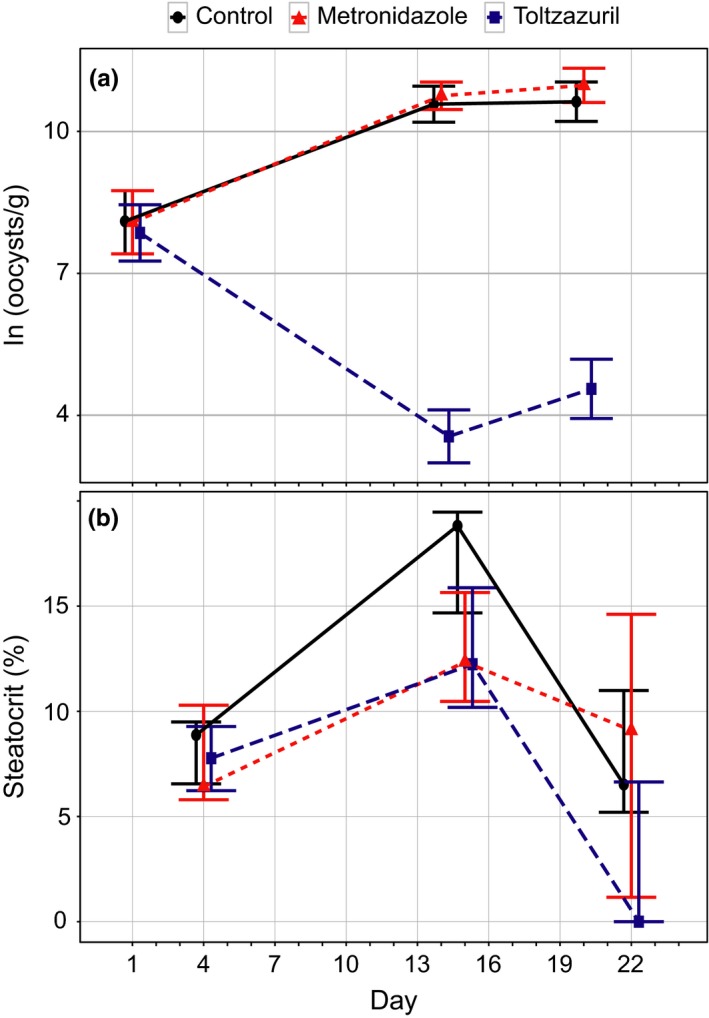
Figure 5.

Effects of medication on intensity of coccidiosis (a) and steatocrits in male greenfinches. Means ± SE in (a), medians ± interquartile ranges in (b). Twenty‐two birds in control group and 23 birds in both medicated groups in the analysis of infection intensity. Twenty‐one birds in control and metronidazole group, 23 birds in toltrazuril group in the analysis of steatocrit. See Table 1 for p‐values for coccidiosis and text for steatocrit
