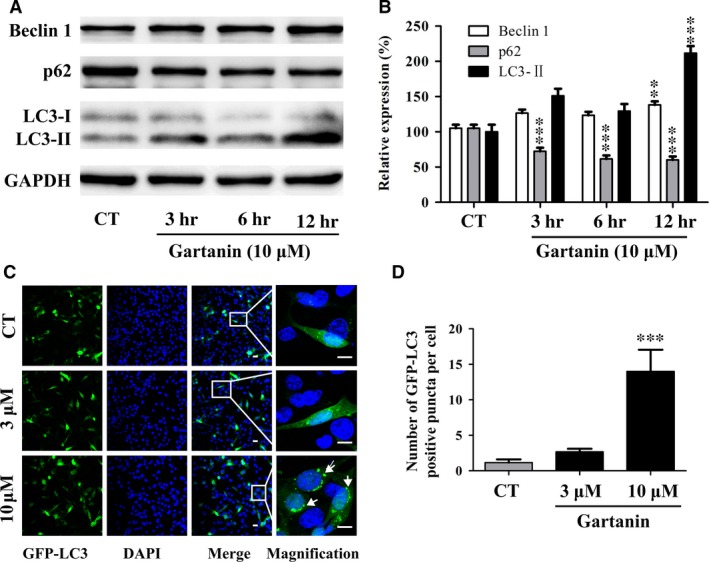
Figure 6.

Gartanin induces autophagy in T98G glioma cells. (A) T98G cells are treated with 10 μM of gartanin for indicated periods of time. The protein levels of Beclin 1, p62 and LC3‐I/II are assayed by Western blot. Representatives of three independent experiments are shown. (B) Relative density of Beclin 1, p62 and LC3‐I/II are determined by densitometry of the blots. **P < 0.01, ***P < 0.001 versus the control group. (C) Representative images (200×) and higher magnification images (600×) of the indicated regions of T98G cells with green fluorescent protein‐light chain 3 (GFP‐LC3) puncta are shown. Scale bar = 100 μM. (D) Quantitative analysis of GFP‐LC3 positive puncta per cell. ***P < 0.001 versus the control group.
