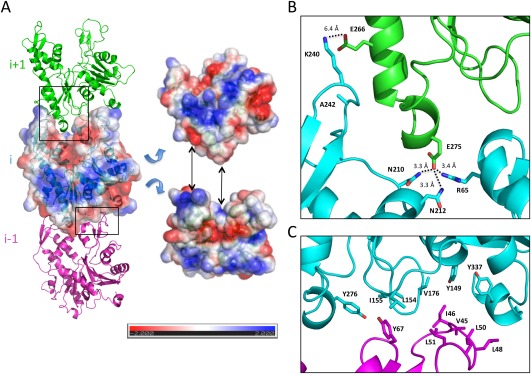
Figure 4.

Longitudinal contacts in filament assembly. (A) Three adjacent molecules (i − 1, i, and i + 1) along the helical axis are shown in cartoon representation, in magenta, cyan, and green, respectively. For the central i molecule, a surface representation is also shown, colored according to surface charge. Tilted views of the protomer with charge representation is on the right, illustrating the charge complementarity between a positively charged top edge and a negatively charged bottom edge. (B) Close‐up view of the interface between domain IIb from molecule i and domain IIa of molecule i + 1 (indicated by a black box in (A)), with interacting residues in sticks. Two sets of interactions, each including a salt bridge and additional bonds, can be identified. We note that the distance between Glu 266 and Lys 240 is too large for a bona fide salt bridge, which could be due to errors in our structural model in this region, or could indicate long‐range electrostatics interactions. (C) Close‐up view of the interface between domain Ib from molecule i − 1 and domain Ia of molecule i (indicated by a black box in (A)), with interacting residues in sticks. Several hydrophobic residues, particularly in the loop between residues 48 and 51 (molecule i − 1) and between residues 149 and 155 (molecule i) are exposed.
