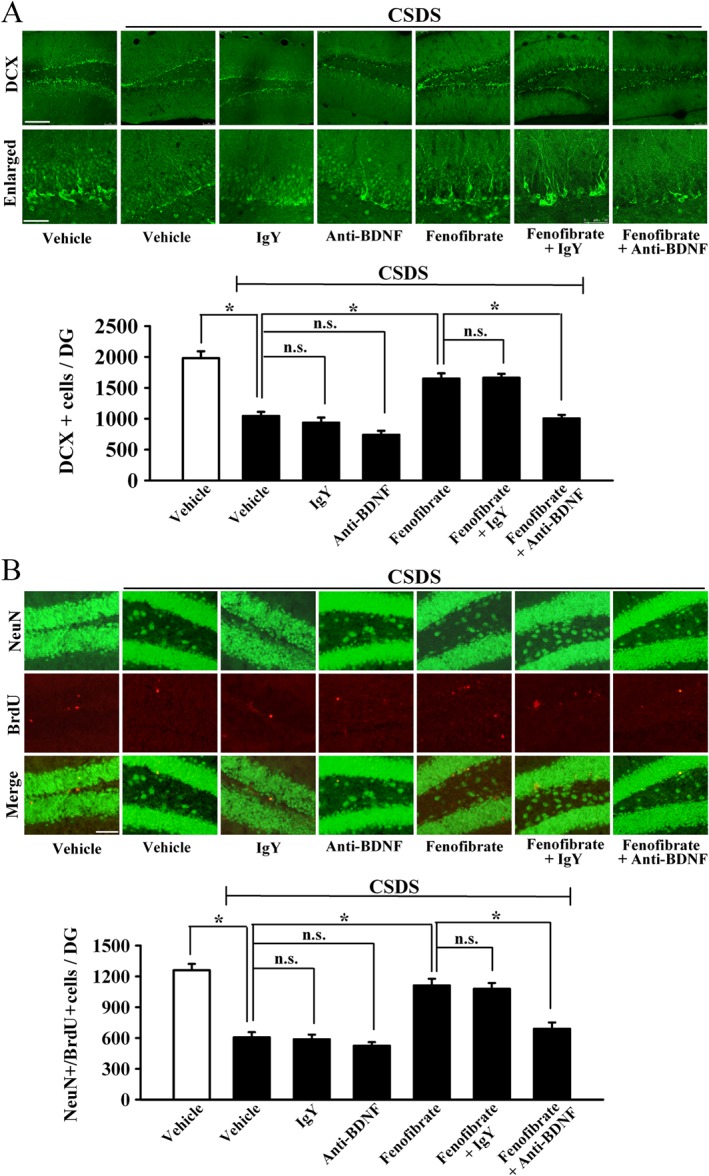
Figure 8.

Anti‐BDNF infusion prevents the neurogenic effects of fenofibrate. (A) Representative confocal microscopic images show the staining of doublecortin (DCX; green) in the dentate granule cell layer. The scale bar is 150 μm for representative images and 50 μm for enlarged images respectively. Density statistics show that the increased number of DCX‐positive cells induced by fenofibrate was blocked by an infusion of anti‐BDNF antibody. (B) Representative microscopic images show the co‐staining (yellow) of neuronal nuclei (NeuN) (green) and BrdU (red) in the DG. The scale bar is 75 μm. Density statistics show that co‐treatment with anti‐BDNF antibody abolished the fenofibrate‐induced effects on the amount of NeuN+/BrdU+ cells in the DG. Data are expressed as means ± SEM (n = 5); * P < 0.05; n.s., no signifcance. Comparisons were made by two‐way ANOVA followed by post hoc Bonferroni's test.
