
Figure 1.
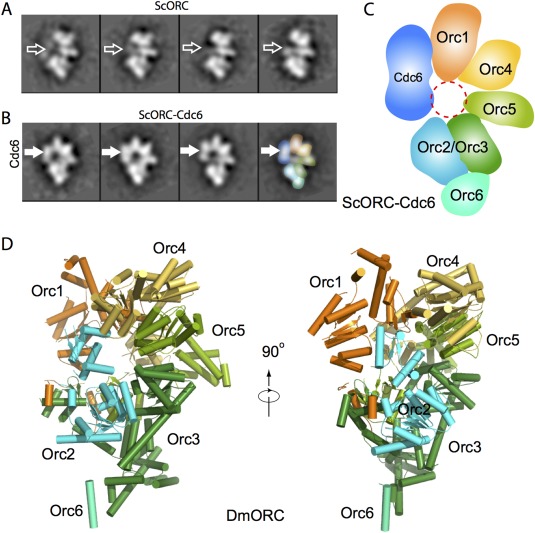
Structures of ScORC and DmORC as determined by EM and X‐ray crystallography, respectively. A: 2D class averages of the purified ORC in the presence of the 66 bp ARS1‐containing dsDNA. B: Class averages of ORC‐Cdc6‐DNA. The thicker horizontal arrows mark the absence (A) or presence (B) of the Cdc6 density. C: A sketch of the subunit arrangement of ORC‐Cdc6 as determined by the MBP fusion approach. D: Crystal structure of the fly ORC in a side and an edge view (PDB ID: 4XGC).