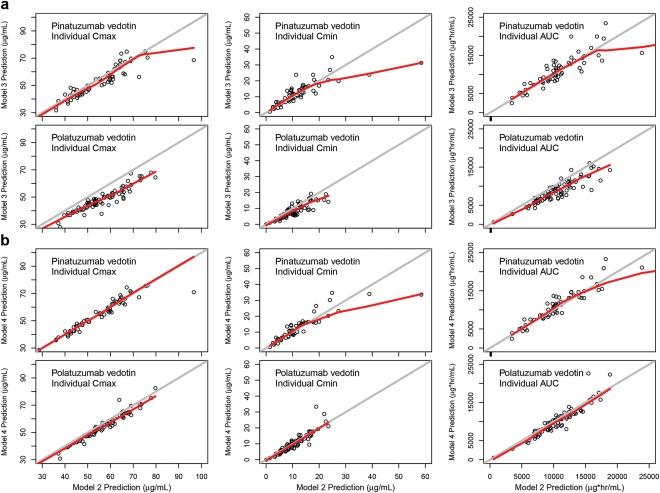
Figure 5.

Comparison of model‐predicted Tab PK exposure parameters (Cmax, Cmin, and AUC) at steady state for (a) Model 3 vs. Model 2 and (b) Model 4 vs. Model 2, for subjects from the phase II study for pinatuzumab vedotin and polatuzumab vedotin, respectively. Black open circle: PK exposure parameter of each individual patient from the phase II study; red line: LOESS smooth line.
