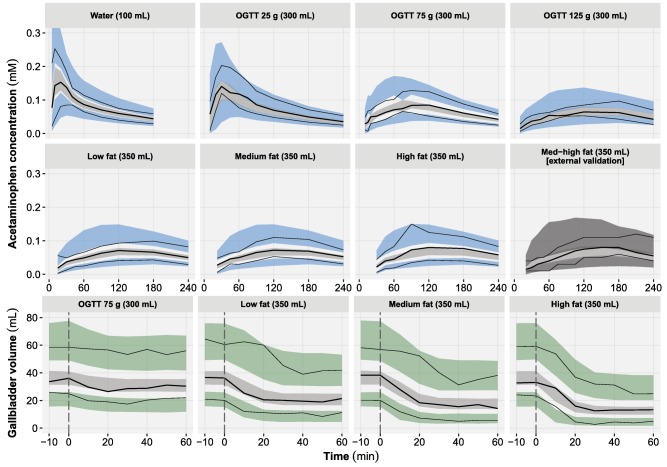
Figure 2.

Visual predictive checks of the acetaminophen plasma concentration (top) and gallbladder volume (bottom) time course and stratified by test drink. For each panel, the median (bold lines), 5th and 95th percentiles (thin lines) of the observed data are compared to the 95% confidence intervals (shaded areas) for the median (light gray), 5th and 95th percentiles of the simulated data (blue/dark gray: acetaminophen, green: gallbladder volume) (based on 1,000 simulations). The external validation of acetaminophen was performed by simulation only. The vertical lines (dashed gray) represent the time of the test drink administration. OGTT, oral glucose tolerance test.
