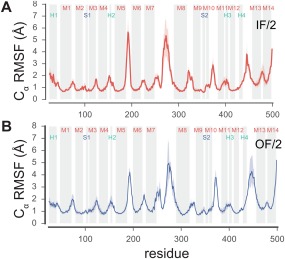
Figure 5.

Fluctuation of residues during MD simulations. The root mean square fluctuation (RMSF) for Cα atoms was computed after superposition of all TM helices with RMSD minimization. Transmembrane helices and other secondary structure elements noted in Supporting Information Figures S3 and S4 are indicated as shaded regions. Data represent averages over equivalent simulations and over both chains of the dimer and are representative of all simulations from a given model. Heavy lines correspond to the mean whereas bands indicate an interval containing 95% of the data, as determined by bootstrapping. (A) Data from inward‐facing model based on Frealix reconstruction (simulations IF/2.1 and IF2.2, see Table II). (C) Data from outward‐facing model generated by MDFF (simulations OF/2.1, OF/2.2, and OF/2.3).
