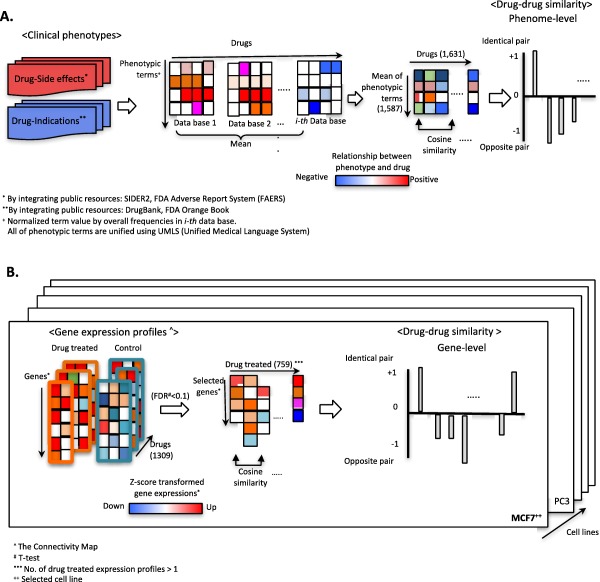
Figure 1.

Pipeline for identifying drug‐drug relationships using phenotype and gene expression signatures. (a) Drug‐associated hybrid phenotypes, including side effects and therapeutic indications, were prepared via integration of multiple public resources, as noted. Directionality and normalized term values for each phenotype for each drug were determined as described in the Methods section. After aggregating term values, we computed cosine similarities between drug pairs (−1 or +1). (b) Data preparation and analysis procedure for gene‐signature based cosine similarity for two queried drugs. For direct comparisons of drug pairs, we transformed gene expression signatures as z‐scores. Drug‐associated gene signatures were prepared by t test analysis (false discovery rate [FDR] <0.1). Finally, transformed gene signatures for a drug consisted of high‐dimensional gene spaces to analyzed cosine similarity for drug pairs.
