Figure 2.

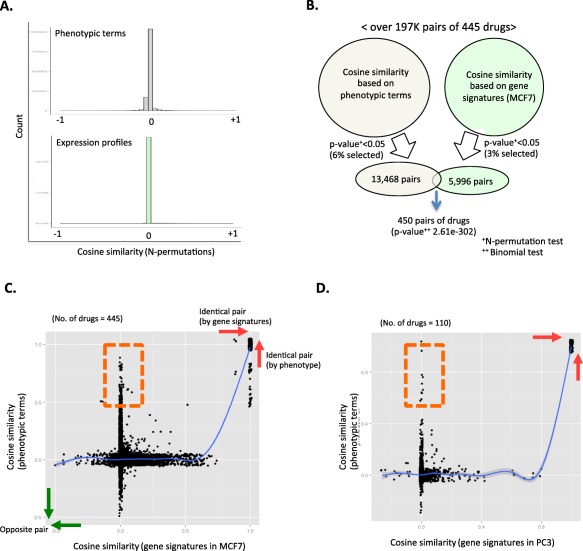
Comparison between phenotype and gene‐signature based cosine similarity. (a) Random distributions of cosine‐similarity measures using drug‐phenotypic term relations (upper chart) and gene expressions (lower part) by N‐permutation approach. (b) Vann diagram of selected similar drug pairs by using phenotypic terms (light gray) and gene signatures in MCF7 (light green). All lists of selected 450 drugs are presented in Supplementary Table S1. Gene‐signature‐based cosine similarity are in red. Prednisone (blue) is an example of disparity of phenotype and gene‐based cosine‐similarity analysis. Cosine similarity scores for phenotype and gene‐based results were quantile normalized for direct comparison. (c,d) Relationships between phenotype‐based and gene‐based cosine similarity in each cell line (c) comparison between cosine similarity based on phenotype and gene signatures in MCF7; (d) utilized gene signatures in PC3.
