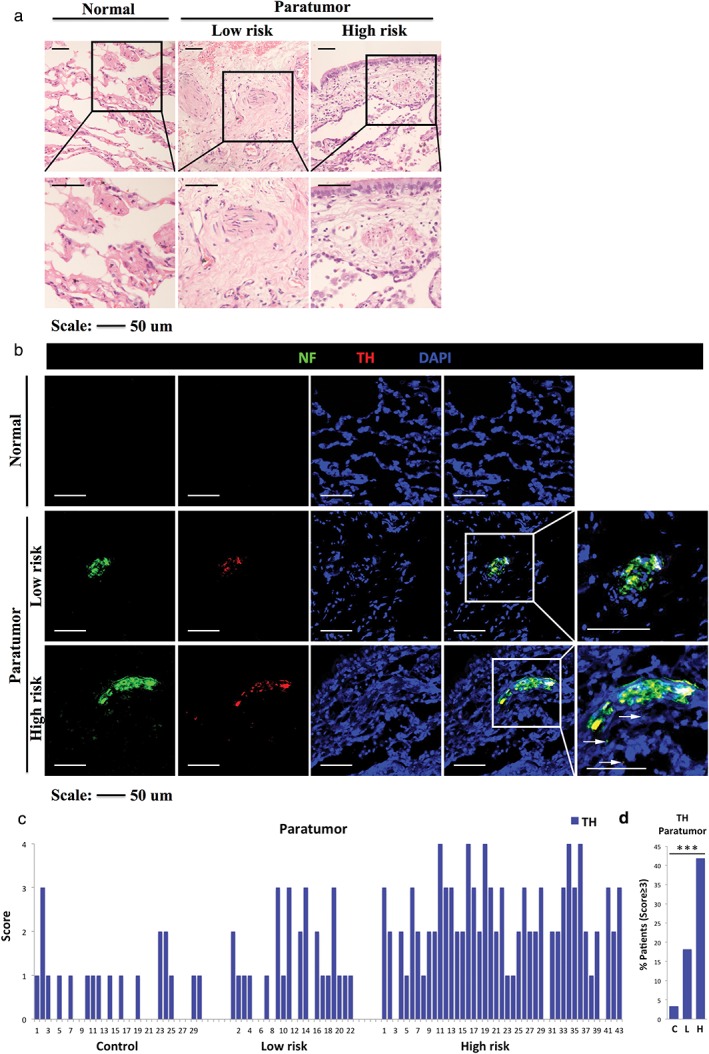
Figure 1.

(a) Representative hematoxylin and eosin (H&E) images of normal lung tissue in the control (left), paratumoral lung tissue in the low‐risk (middle) and high‐risk groups (right). Boxed area shows a higher magnification of H&E images (similar size as [b]). (b) Almost consecutive frozen sections stained with immunofluorescence for neurofilament (NF; a specific nerve marker), tyrosine hydroxylase (TH; an adrenergic marker) and 4′,6‐diamidino‐2‐phenylindole (DAPI) of normal lung tissue in the control (score = 0), and paratumoral lung tissue in the low‐risk (score = 2) and high‐risk groups (score = 4). Boxed area shows higher magnification of infiltrating nerves. Arrows show tiny nerve fibers. (c) Score of immunostained TH+ neural fibers in normal lung tissue in the control (n = 30), in paratumoral lung tissue in the low risk (n = 22) and high‐risk groups (n = 43). (d) Percentage of cancer patients with TH+ score ≥ 3 in the control, low‐risk and high‐risk groups. ***P < 0.001. Scale bar, 50 μm.
