Fig. 2.
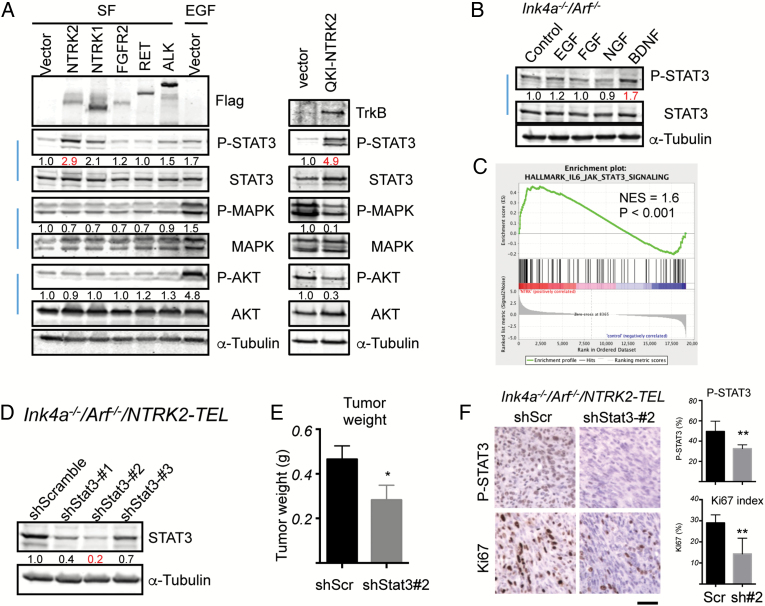
Upregulation of STAT3 signaling by constitutively activated TrkB. (A) Ink4a−/−/Arf−/− astrocytes expressing vector, RTK-TELs, or QKI-NTRK2 as indicated were serum starved (SF) overnight. SF starved Ink4a−/−/Arf−/− astrocytes expressing vector treated with 10 ng/mL EGF for 5 min as a control for signaling activation. Cell lysates were subjected to western blotting analysis with the indicated antibodies. Band intensities of phospho-proteins were quantified and normalized relative to the quantity of their respective total protein bands, and then expressed as fold difference compared with the vector-expressing samples. Images are representative of at least 2 independent experiments. (B) Ink4a−/−/Arf−/− astrocytes were serum starved overnight followed by 3-h stimulation with 10 ng/mL EGF, 10 ng/mL FGF2, 100 ng/mL NGF, or 100 ng/mL BDNF and western blot analyses with the indicated antibodies. Band intensities of phospho-STAT3 were quantified and normalized relative to the respective total STAT3 bands and expressed as the fold difference compared with the control sample. Images are representative of 2 independent experiments. (C) Gene Set Enrichment Analysis plot of interleukin-6–JAK-STAT3 gene set in Ink4a−/−/Arf−/−/NTRK2-TEL vs Ink4a−/−/Arf−/−/Vector astrocytes. Enrichment plot: bottom, plot of the ranked list of all genes. y-Axis, value of the ranking metric; x-axis, the rank for all genes. Normalized enrichment score (NES) was 1.6, nominal P < .001. (D) Knockdown of Stat3 in Ink4a−/−/Arf−/−/NTRK2-TEL astrocytes. Ink4a−/−/Arf−/−/NTRK2-TEL astrocytes stably expressed each indicated shRNA. Cell lysates were subjected to western blot analysis with the indicated antibodies. Band intensities of STAT3 were quantified and normalized relative to the quantity of α-tubulin bands, and then expressed as the fold difference compared with the shScramble sample, which was set as 1.0. (E) Tumor weight of Ink4a−/−/Arf−/−/NTRK2-TEL/shScr (shScr) and Ink4a−/−; Arf−/−/NTRK2-TEL/shStat3-#2 (shStat3-#2) s.c. allograft models in nude mice. Values represent means ± SEM, n = 6 per group. *P < .05. (F) IHC analysis of pSTAT3 and Ki67 in the indicated astrocytomas. Scale bar, 50 μm. Bar graphs represent mean ± SD of quantification of pSTAT3 and Ki67 in tumors (*P < .05, **P < .01).

