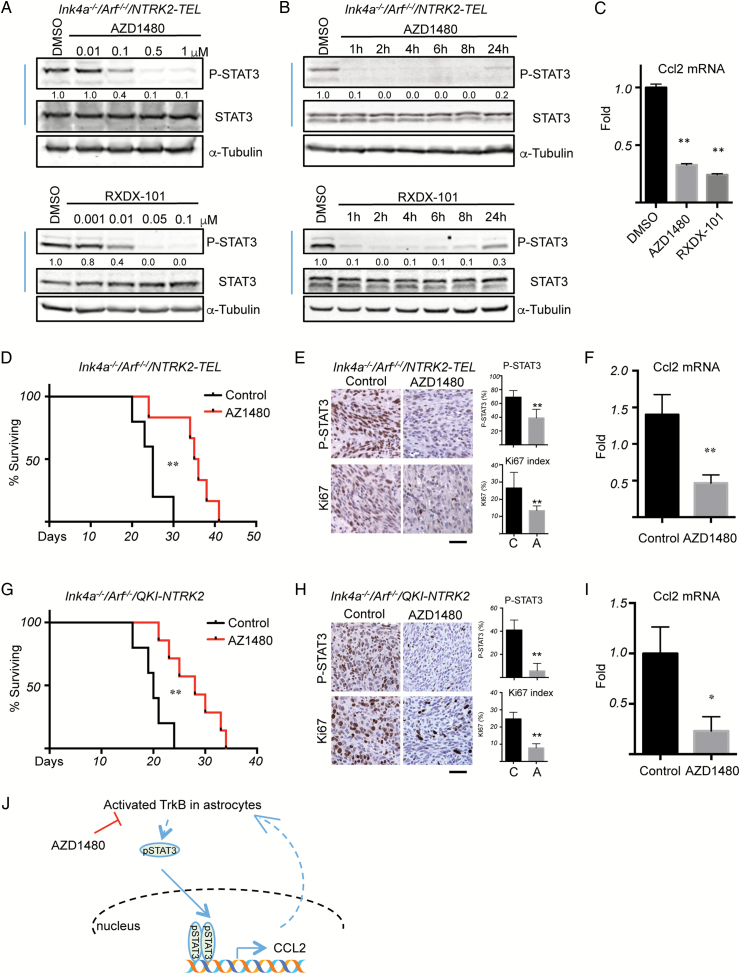
Fig. 4.
Inhibition of TrkB activity suppresses tumor growth initiated by activated TrkB. (A) Ink4a−/−/Arf−/−/NTRK2-TEL astrocytes were treated with different concentrations of AZD1480 (upper panel) or RXDX-101 (lower panel) for 1 h. (B) Cells were treated with 0.5 μM AZD1480 (upper panel) or 0.05 μM RXDX-101 (lower panel) for the indicated times. Western blot analyses were then performed with the indicated antibodies. Band intensities of pSTAT3 were quantified and normalized relative to the quantity of respective STAT3 bands, and then expressed as the fold difference compared with the dimethyl sulfoxide (DMSO) sample, which was set as 1.0. Images are representative of at least 2 independent experiments. (C) Quantitative PCR analysis of mRNA expression levels of Ccl2 in Ink4a−/−/Arf−/−/NTRK2-TEL astrocytes treated with 0.5 μM AZD1480 or 0.05 μM RXDX-101 for 4 h. Data from the DMSO treatment were set to 1.0; n = 3, data show mean ± SD. (D) Kaplan–Meier survival curves of mice bearing intracranially implanted Ink4a−/−/Arf−/−/NTRK2-TEL astrocytes. After 4 days of tumor engraftment, mice were treated with control (black line, n = 5) or AZD1480 (50 mg/kg, p.o., q.d.) (red line, n = 6). (E) IHC analyses of pSTAT3 and Ki67 expression in Ink4a−/−/Arf−/−/NTRK2-TEL allograft tumor samples of mice treated with control or AZD1480 (50 mg/kg, p.o., q.d.) for 4 days. Tumors were collected 2 h after the last dose, fixed, and subjected to IHC analyses. Scale bar, 50 μm. Bar graphs represent mean ± SD of quantification of pSTAT3 and Ki67 in tumors. (F) Quantitative PCR analysis of Ccl2 mRNA levels in glioma induced by activated TrkB after treatment with control or AZD1480. The value from one control sample was set to 1.0, n = 3 (control) or n = 5 (treatment), data show mean ± SEM. (G) Kaplan–Meier survival of mice bearing intracranially implanted Ink4a−/−/Arf−/−/QKI-NTRK2 astrocytes. After 4 days of tumor engraftment, mice were treated with control (black line, n = 5) or AZD1480 (50 mg/kg, p.o., q.d.) (red line, n = 7). (H) IHC analyses of pSTAT3 and Ki67 in Ink4a−/−/Arf−/−/QKI-NTRK2 allograft tumor samples of mice treated with vehicle or AZD1480 (50 mg/kg, p.o., q.d.). Tumors were collected 2 h after the last dose, fixed, and subjected to IHC analyses. Scale bar, 50 μm. Bar graphs represent mean ± SD of quantification of pSTAT3 and Ki67 in tumors. (I) Quantitative PCR of Ccl2 mRNA levels in gliomas induced by QKI-NTRK2 treated with control or AZD1480. The value from one control was set to 1.0; n = 5 (control) or n = 3 (treatment), data show mean ± SEM. *P < .05, **P < .01. (J) A working model of TrkB-STAT3 signaling in astrocytoma.

