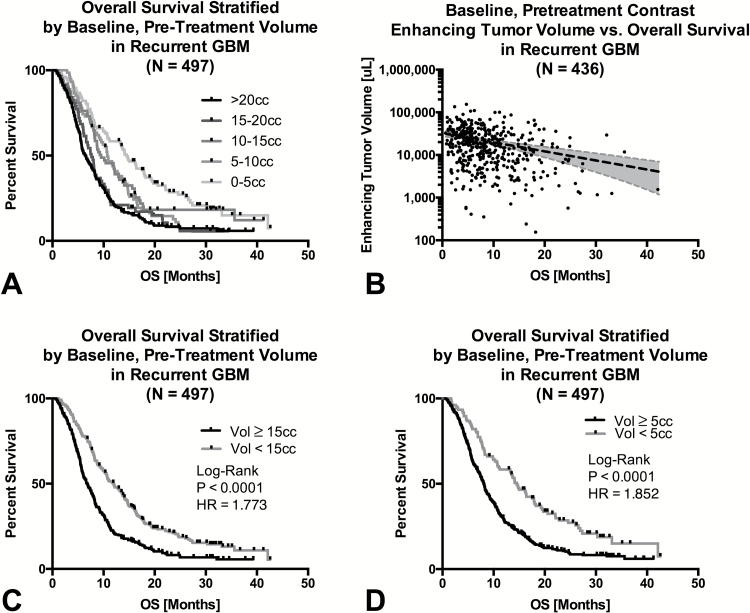
Fig. 3.
Influence of baseline contrast enhancing tumor volume on OS in a composite cohort of patients with recurrent GBM (N = 497). (A) Kaplan–Meier plots of OS in recurrent GBM grouped by baseline contrast enhancing tumor volume. Results demonstrate 3 distinct groupings of OS for tumors >15cc, between 5cc and 15cc, and less than 5cc. (B) In patients who expired at the time of evaluation (436 of 497 patients), results showed a significant log-linear trend indicating decreasing OS with increasing tumor volume. (C) Kaplan–Meier plots of OS in recurrent GBM patients stratified by large (≥15cc) and small (<15cc) tumor volume. (D) Kaplan–Meier plots of OS in recurrent GBM patients stratified by very small (<5cc) and larger (≥5cc) tumor volume.

