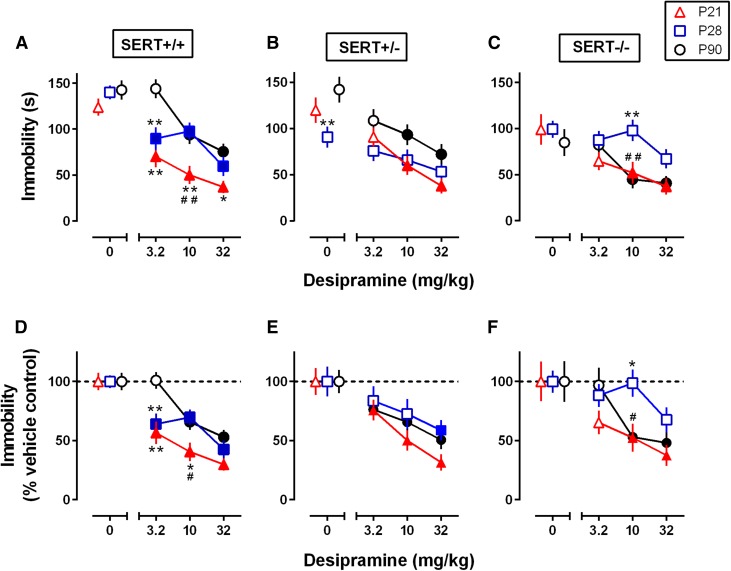
Fig. 1.
Influence of age and SERT genotype on the antidepressant-like effect of DMI. (A–C) Dose-dependent reductions in immobility time in the TST in P21, P28, and P90 SERT+/+ mice (A), SERT+/− mice (B), and SERT−/− mice (C). (D) Data from (A) expressed as a percentage of vehicle control. (E) Data from (B) expressed as a percentage of vehicle control. (F) Data from (C) expressed as a percentage of vehicle control. Data obtained in males and females are pooled, because a multifactor ANOVA (sex, genotype, DMI) showed no main effect or interaction of sex with other factors (P > 0.05), with one exception between sex and genotype (P < 0.01); however, multiple comparisons failed to show significant sex differences for each genotype (P > 0.05). Data are means ± S.E.M. Filled symbols represent data points that are significantly different from the SERT genotype– and age-matched vehicle control as determined by the Dunnett post hoc multiple comparisons test after a two-factor ANOVA. *P < 0.05 (significant difference from SERT genotype–matched P90); **P < 0.01 (significant difference from SERT genotype–matched P90); #P < 0.05 (significant difference from SERT genotype–matched P28 with the Tukey post hoc multiple comparisons test after a two-factor ANOVA); ##P < 0.01 (significant difference from SERT genotype–matched P28 with the Tukey post hoc multiple comparisons test after a two-factor ANOVA). Sample sizes per data point were as follows: SERT+/+, n = 21–31 (9–14 males and 10–20 females, pooled); SERT+/−, n = 16–20 (8–10 males and 8–12 females, pooled); and SERT−/−, n = 18–23 (8–10 males and 9–14 females, pooled).

