Fig. 5.
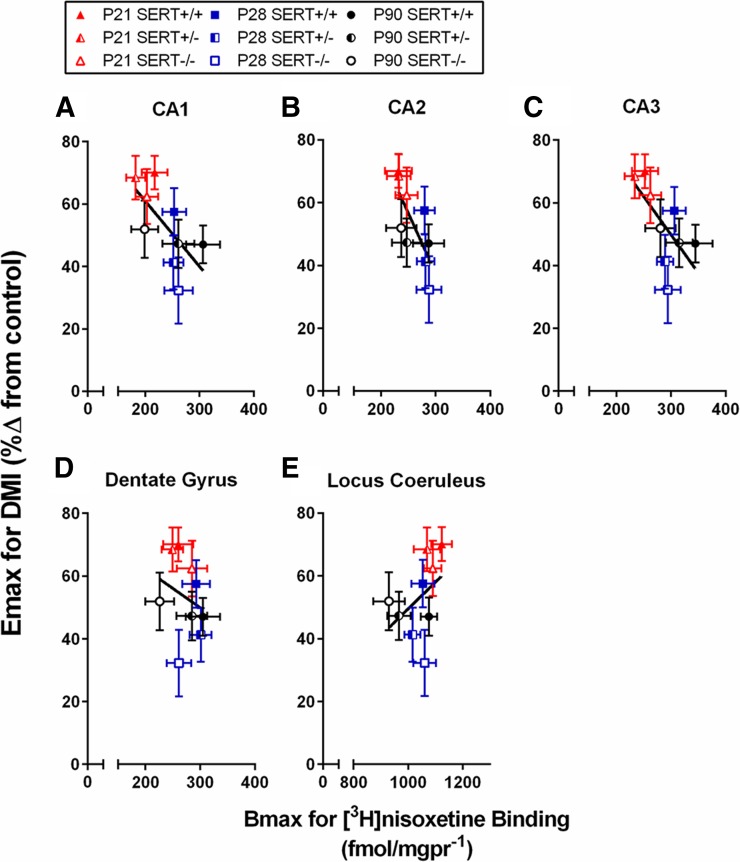
Relationship between Emax values for DMI to produce antidepressant-like effects in the TST and Bmax values for specific [3H]nisoxetine binding in the locus coeruleus as a function of age and SERT genotype. The CA1 region (A), CA2 region (B), CA3 region (C), dentate gyrus (D), and locus coeruleus (E) are shown. Relationship between Emax and Bmax did not vary by SERT genotype; thus, one line was used to fit data regardless of genotype. Data are taken from Fig. 1, D–F (per data point: SERT+/+, n = 21–31; SERT+/−, n = 16–20; and SERT−/−, n = 18–23), and Fig. 4 (per age group: SERT+/+, n = 5–9; SERT+/−, n = 6–10; and SERT−/−, n = 4–7). Data are means ± S.E.M. (male and female data are pooled).

