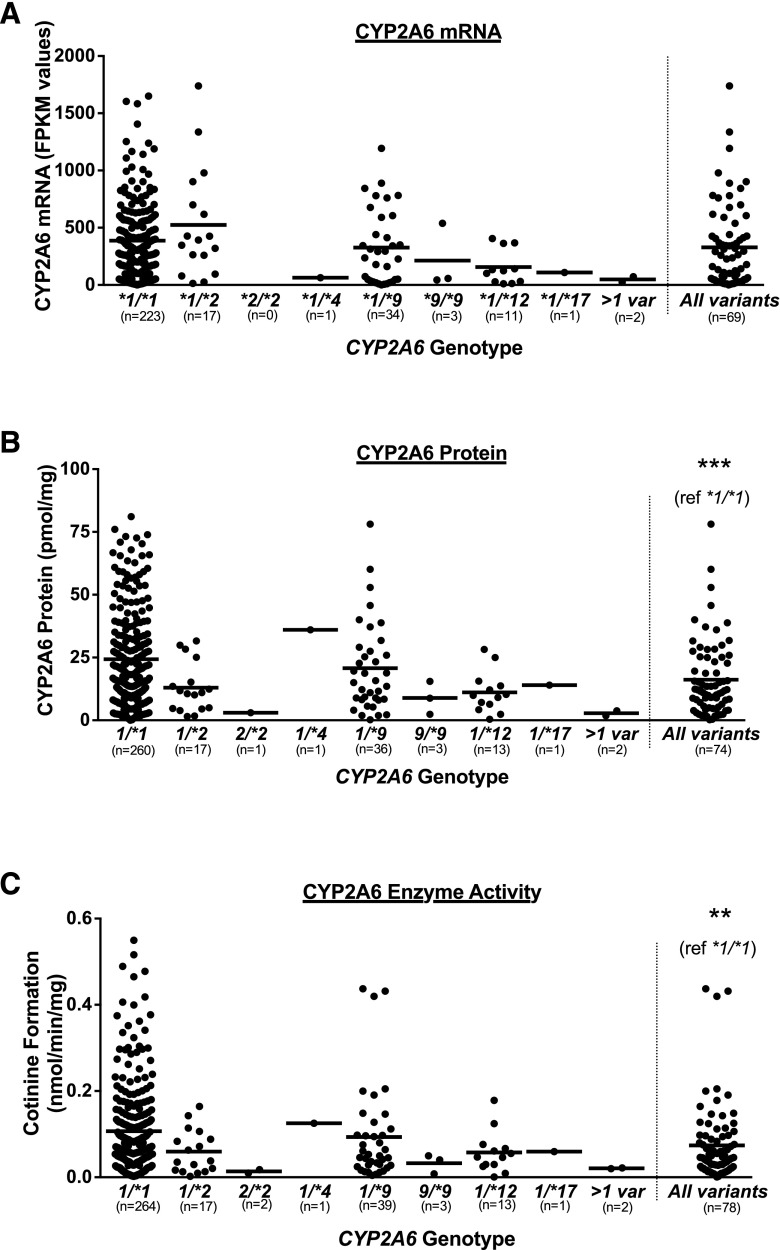
Fig. 4.
Association of CYP2A6 genotype with (A) CYP2A6 mRNA levels (FPKM values), (B) CYP2A6 protein levels (pmol/mg), and (C) CYP2A6 enzyme activity (cotinine formation from nicotine, nmol/min per milligram). Horizontal lines represent the mean for each genotype. Three data points exceed the y-axis limit for CYP2A6*1/*1 group in (A), two data points exceed the y-axis limit for CYP2A6*1/*1 group in (B), and two data points exceed the y-axis limit for CYP2A6*1/*1 group in (C); all points were included in the mean and statistical tests. **P < 0.01, ***P < 0.001, on the basis of Mann Whitney tests.

