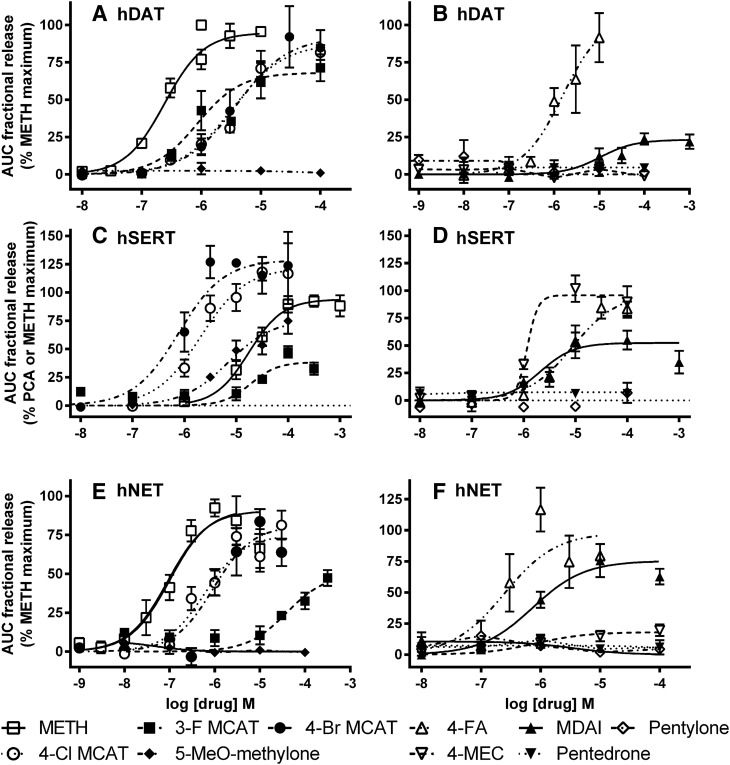
Fig. 4.
Concentration-response curves of [3H]neurotransmitter release by METH, 3-F MCAT, 4-Cl MCAT, 4-Br MCAT, 4-FA, MDAI, 4-MEC, pentedrone, pentylone, and 5-MeO-methylone. hDAT (A and B), hSERT (C and D), and hNET (E and F) cells. The AUC for each drug concentration was normalized to the maximal effect of METH for that experiment (hDAT, hNET, and hSERT) or the maximal effect of PCA (some hSERT). The maximal stimulation of [3H]5-HT release by PCA and METH was similar in experiments when both were tested. Data are the mean and S.E.M. of three or more experiments, except when a drug had no releasing efficacy, in which case the data are the mean and range of two experiments.

