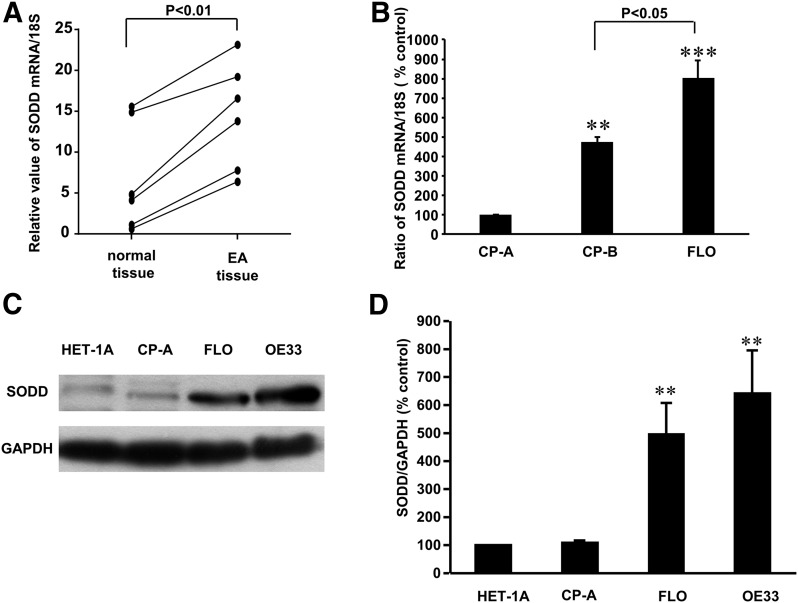
Fig. 1.
SODD expression in different cells and tissues. (A) Real-time reverse-transcription PCR showed that the levels of SODD mRNA were significantly increased in tumor tissues by 345.8% control, when compared with normal esophageal mucosa (N = 6, paired Student t test, P < 0.01). (B) Levels of SODD mRNA were significantly higher in CP-B and FLO cells than in CP-A cells and markedly higher in FLO cells than in CP-B cells. (C) A typical image of three Western blot analyses and (D) summarized data showed that the levels of SODD protein expression were significantly increased in FLO and OE33 EA cells (N = 3), when compared with normal squamous epithelial cells HET-1A and Barrett’s cells. The data suggest that SODD may be important in the development of EA. **P < 0.02, ***P < 0.001, compared with HET-1A cells or CP-A cells.

