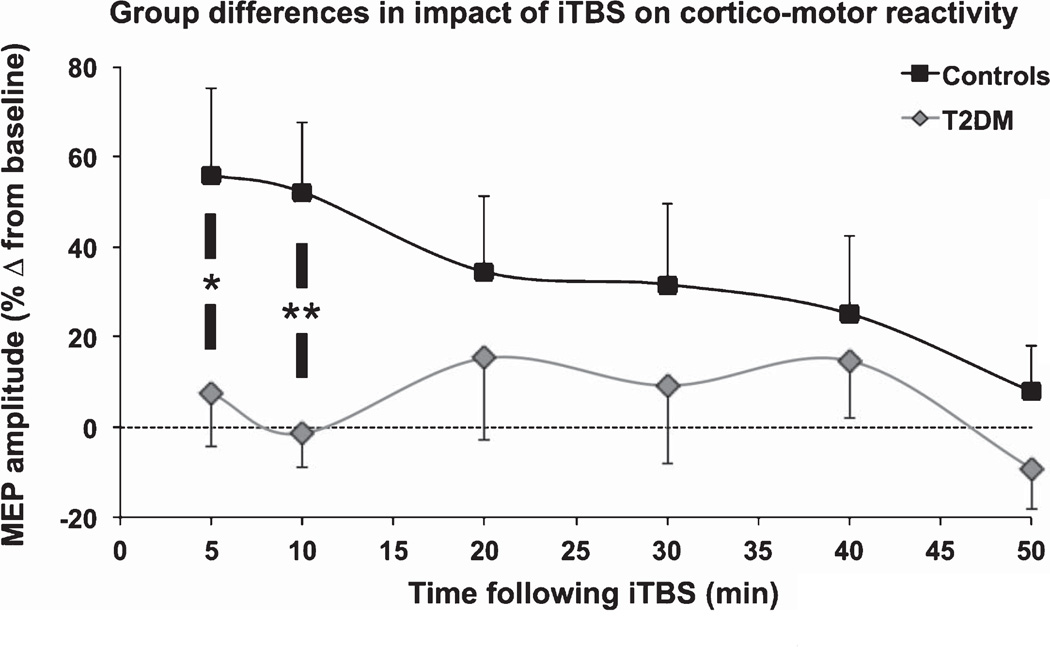
Fig. 2.
Comparison of TMS-plasticity measures by group. Mean and standard error of the percent change in MEP amplitude are shown for each post-iTBS time-point. Pairwise comparisons between controls and T2DM for each time-point were made with Student’s t tests (*p < 0.05, **p < 0.01). 5–10 min after iTBS, the change in MEP amplitudes was significantly reduced in individuals with T2DM relative to controls.

