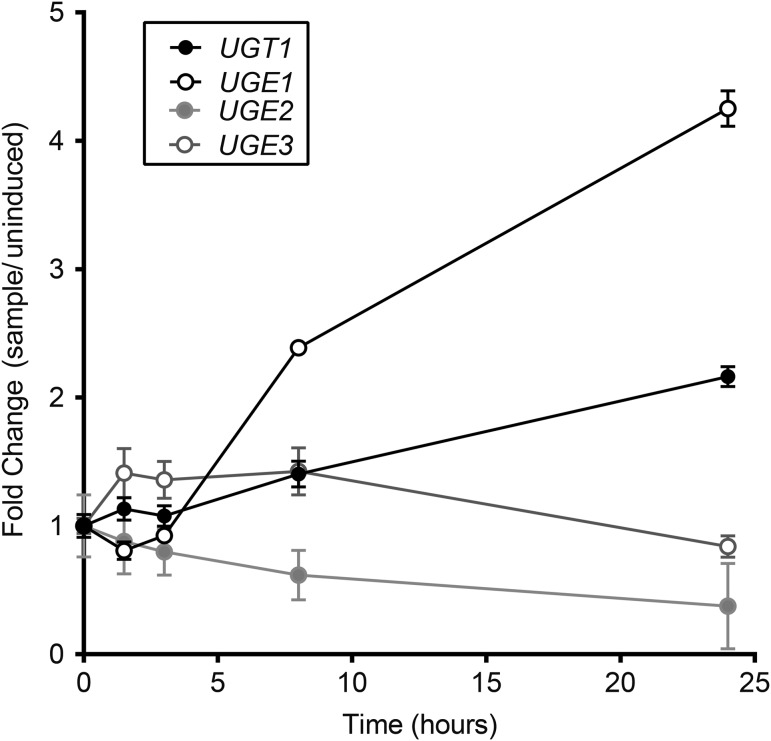
Fig. 5.
Transcription of UGT1 and UGE1 increases during capsule induction. Reads from RNA-seq data (mean ± SD) were normalized to their levels at t = 0, which were UGT1, 383,949 ± 24,018; UGE1, 724,792 ± 19,475; UGE2, 110,719 ± 18,909; UGE3, 1968117 ± 82297. Values shown are compiled from three independent experiments, each with RNA prepared from three biological replicates.

