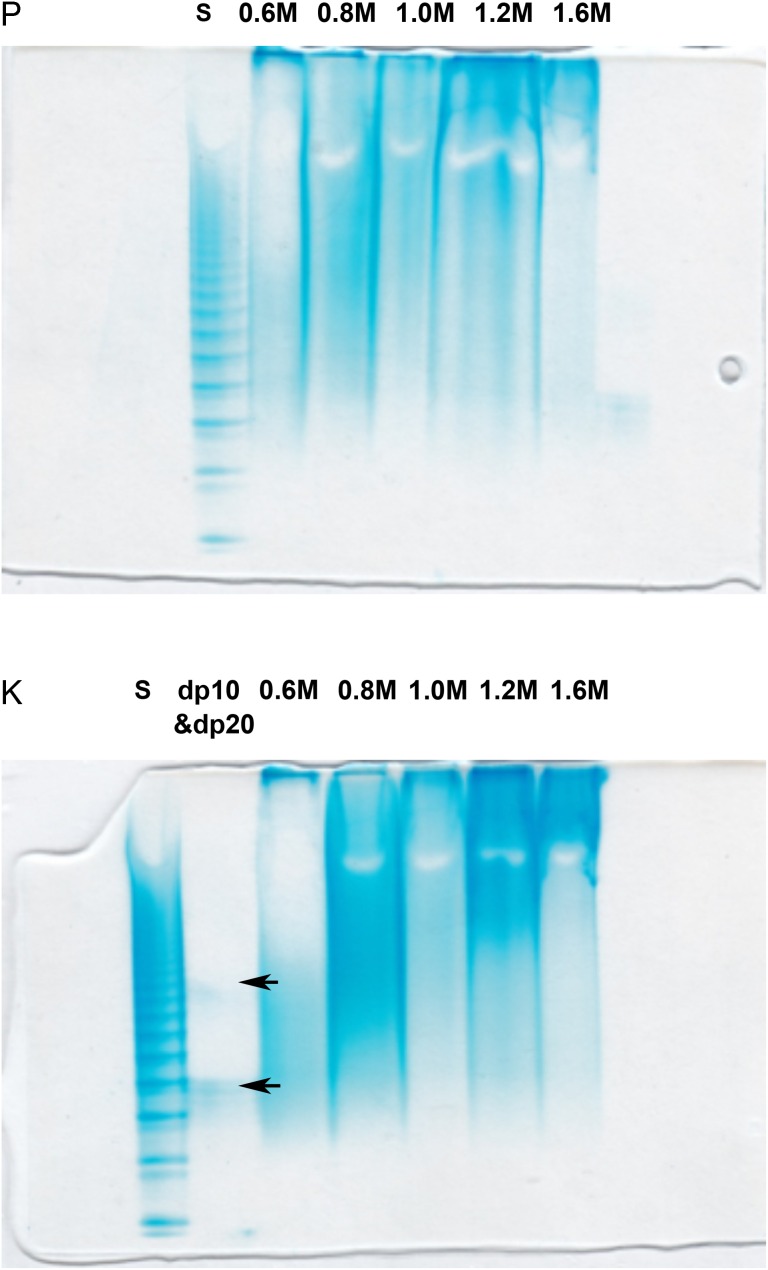
Fig. 2.
PAGE analysis using 15% resolving gel analysis of heparin/heparan sulfate fractions. The top gel shows fractions obtained from P and the bottom gel shows fractions obtained from K. The samples loaded in the lanes in both gels are labeled. S corresponds to a ladder of heparin oligosaccharide standards of known molecular weights, prepared enzymatically from bovine lung heparin (Edens et al. 1992). The sizes of the bands in this ladder were aligned using structurally defined oligosaccharides of degree of polymerization (dp)10 and dp20 indicated with black arrows shown in the lower gel (Pervin et al. 1995). The fractions were analyzed in the remaining lanes of both gels and are labeled as 0.6, 0.8, 1.0, 1.2 and 1.6 M corresponding to their elution described in Figure 1. This figure is available in black and white in print and in color at Glycobiology online.

