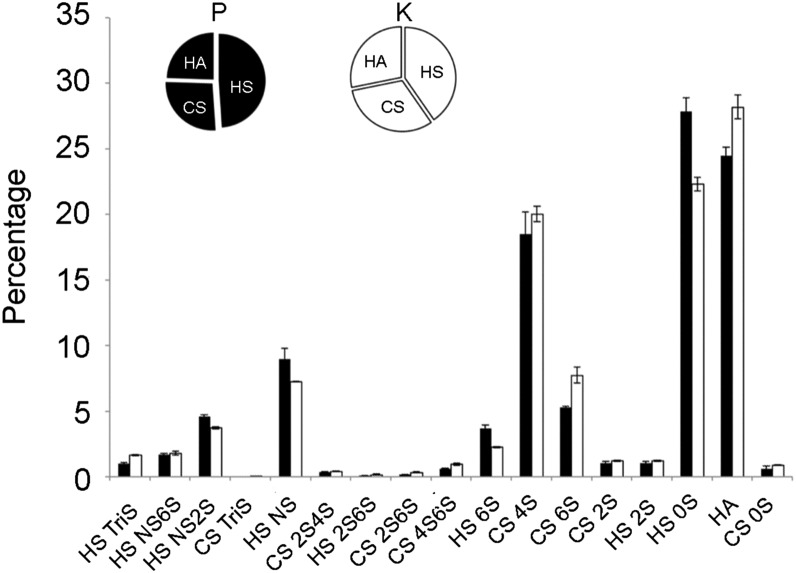
Fig. 3.
Comparison of the GAG components and their disaccharide composition from piglets P and K as determined by HPLC-MS/MS. The pie charts show the proportions of HS, CS and HA from P (black) and K (white). The bar graph shows the mol% of the 17 disaccharides obtained following enzymatic treatment of P (black) and K (white).

