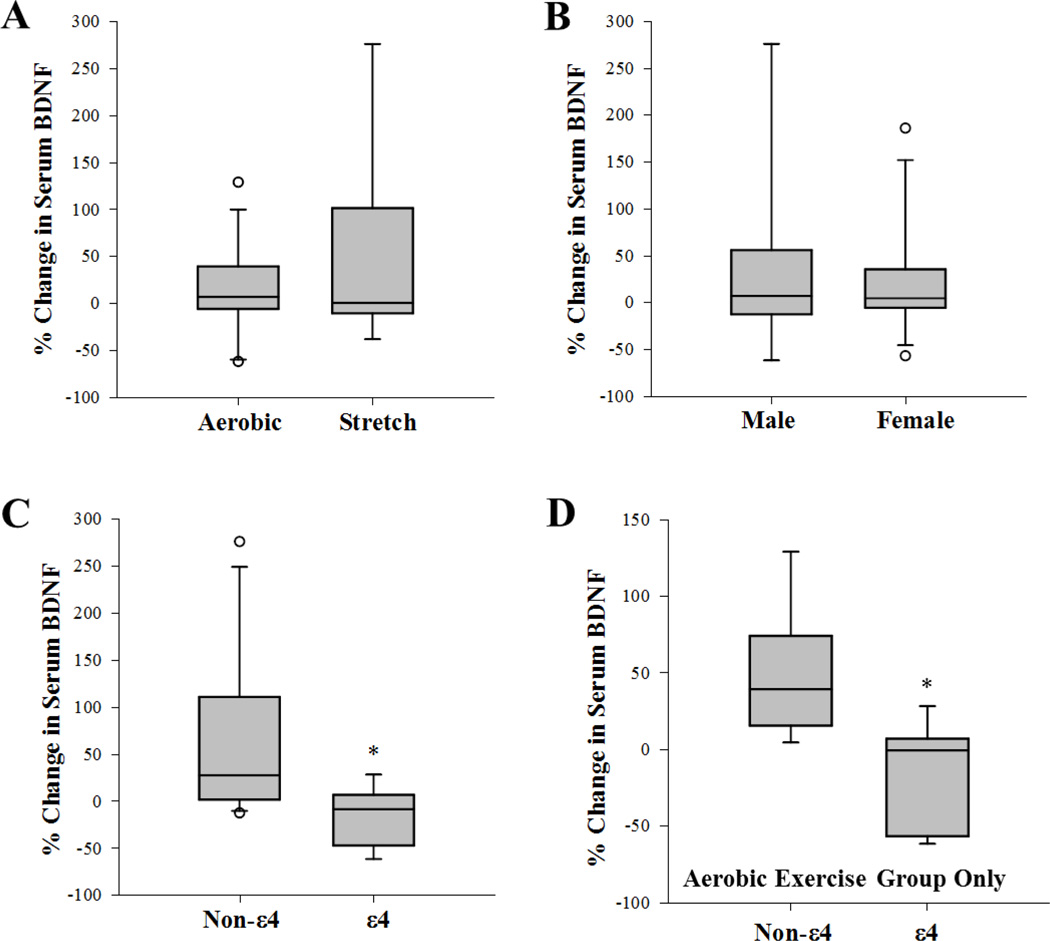
Figure 2.
Box plot of percent (%) change in serum levels of BDNF from baseline values, after 6 months of exercise training (a) between exercise groups, (b) between genders, (c) between non-ε4 and ε4 carriers and (d) between non-ε4 and ε4 carriers only within the aerobic exercise group. Middle line in box represents the median; lower box bounds the first quartile; upper box bounds the 3rd quartile. Whiskers represent the 95% confidence interval of the mean. Open circles are outliers from 95% confidence interval. *Significant difference between groups (P=0.016 and P=0.021 for C and D respectively). Non-ε4 = non carriers of the APOE ε 4 allele, ε4 = carrier of the APOEε4 allele.

