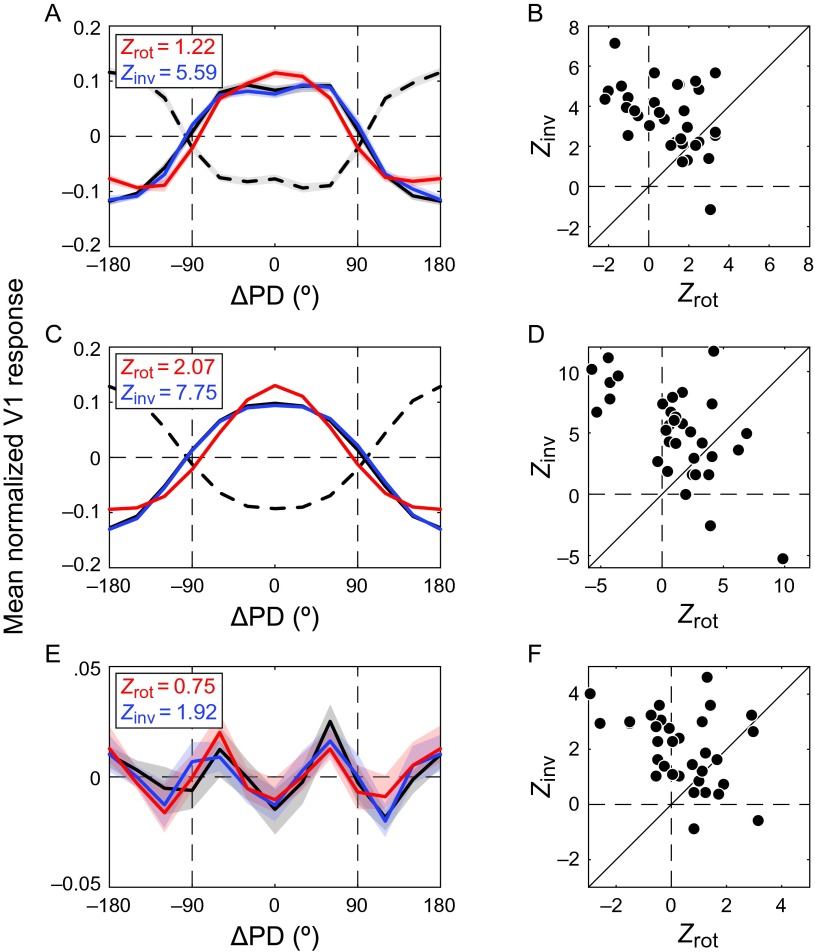
Figure 3.
Comparison of the counterevidence and evidence-only predictions in V1 (N = 33). As predicted by the counterevidence hypothesis, TCC (solid black) correlated more strongly with the iTCI (blue) than with the rotated TCI (red). This was true for (A) the mean tuning curve across the population and (B) the population of tuning curves; (C) the fits to the tuning curves in A; and (D) the individual units' fitted tuning curves. Local irregularities of the TCC, that is, the residuals (E) of the fits to the mean population response and the residuals (F) of the individual units' tuning curves, were also best predicted by inversion of the corresponding TCI residuals. ΔPD denotes deviation from the preferred direction. Shaded regions represent SEM.

