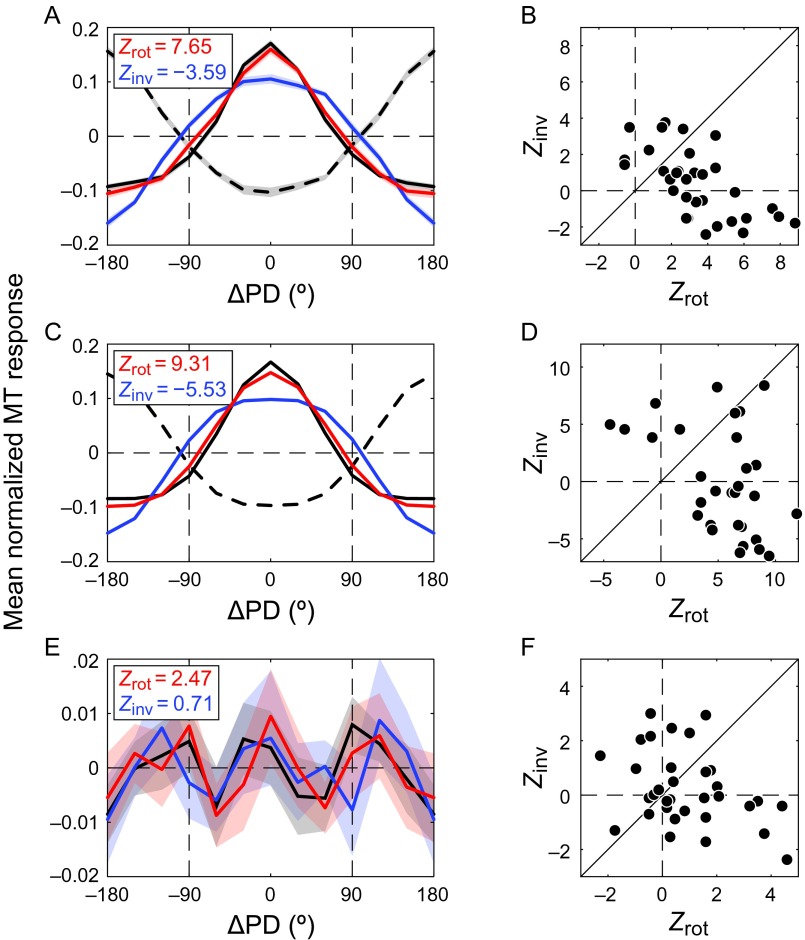
Figure 4.
Comparison of counterevidence and evidence-only predictions in area MT (N = 32). TCC (solid black) correlated strongest with the rotated TCI (red). This was true for (A) the pooled tuning curve and (B) the population of tuning curves; (C) the fits to the pooled population tuning curves in A; and (D) the fits to the individual units' tuning curves. (E) The residual of the fit to the pooled TCC (black) also correlated strongest with the rotated TCI residual (red), but this effect was not significant across the population (F). Same conventions as in Figure 3.

