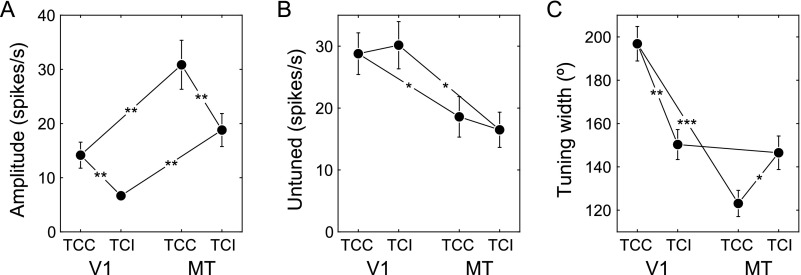
Figure 6.
Quantification of the tuning curve properties in V1 and MT. (A) Amplitude. (B) Untuned response. (C) Half-height tuning width. Connecting lines represent two-sided t-tests (paired within a cortex area, two-sample between areas) with the number of stars indicating significance levels (n+ 1 SD). Error bars represent SEM.

