Figure 12.
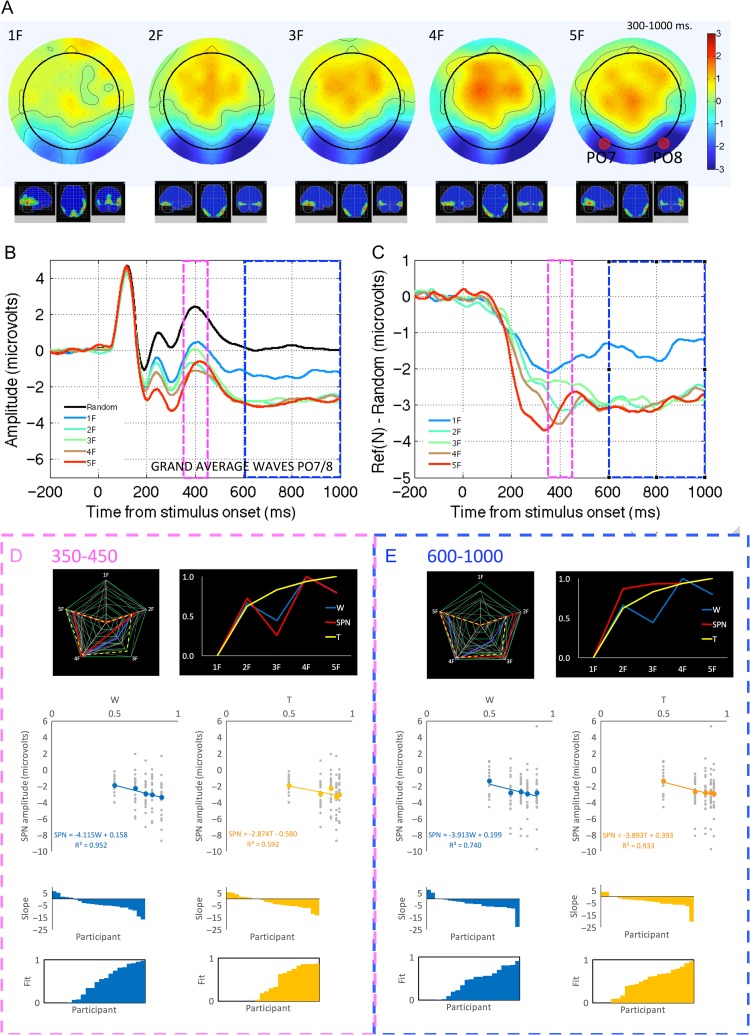
Study 3 ERP results. (A) Topographic difference maps and estimated cortical sources. (B) Grand-average ERP waves at PO7/8 electrodes. (C) Reflection -- random difference waves. The early (350--450 ms) and late (600--1000 ms) windows are highlighted (blue and pink boxes). (D) Analysis of the early window. (E) Analysis of the late window.

