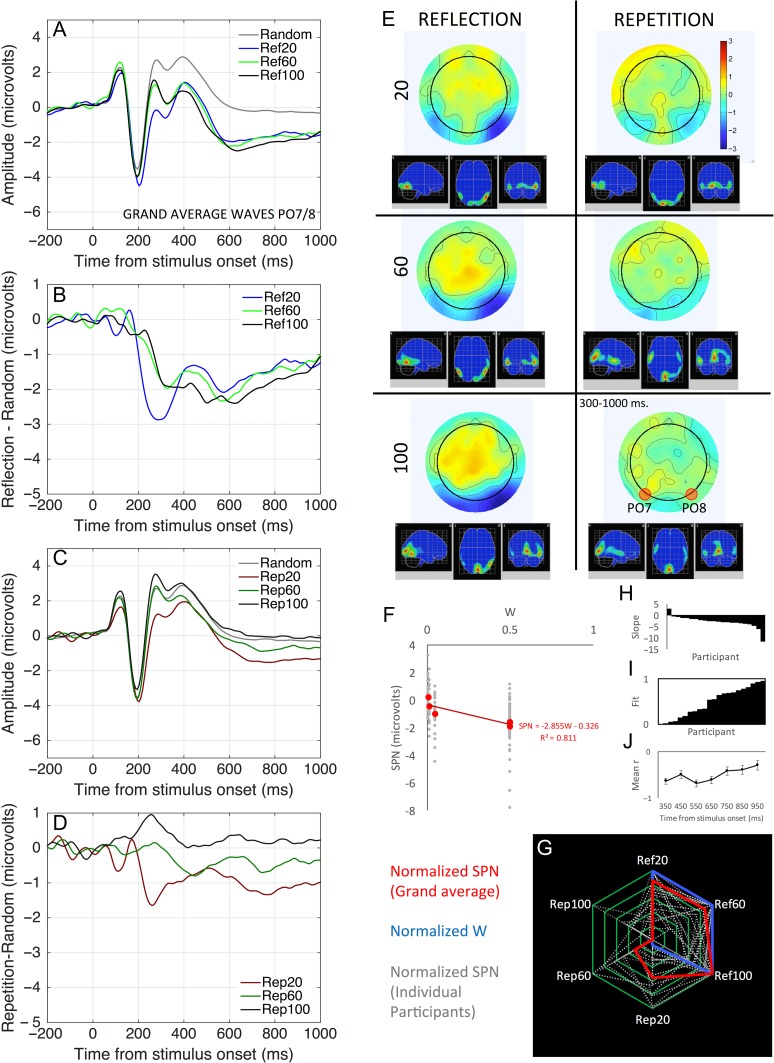
Figure 6.
Study 1 ERP results. (A–D) Grand-average ERP waves at PO7/8 electrodes. (E) Topographic difference maps (regular–random, 300–1000 ms) and estimated cortical sources. (F) Regression analysis of W versus SPN relationship (grand average in red, individual participants in gray, R2 indicates the variance in grand-average SPN explained by W). (G) Radar plot showing overlap between normalized W and SPN (grand average in red, individual participants in gray). (H) Individual participant slope metrics, organized cumulatively. (G) Individual fit metrics, organized cumulatively. (I) Mean correlation between W and SPN in successive time bins. Error bars = ±1 SEM.

