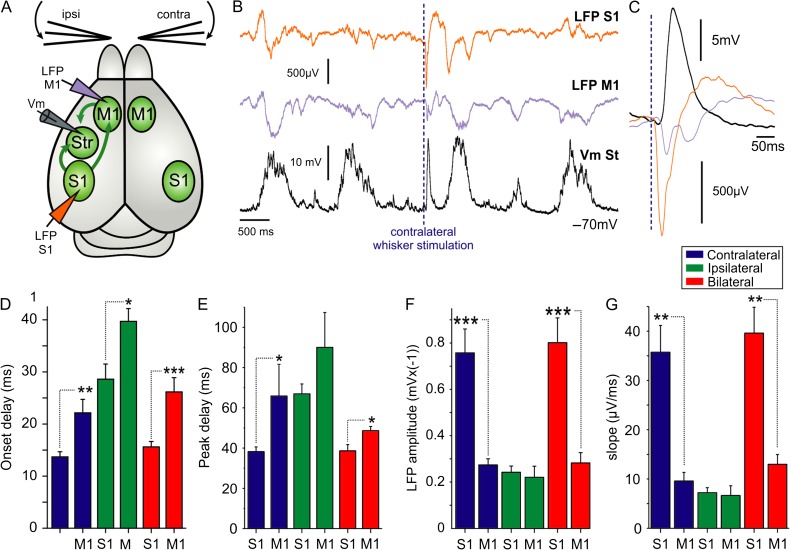
Figure 4.
Whisker deflection activates M1 after the initial response in S1. (A) Diagram of the experimental configuration and synaptic projections; arrows illustrate the ipsilateral synaptic pathways mediating striatal responses to whisker deflection. Extracellular recording electrodes were placed in ipsilateral S1 and M1. (B) Simultaneous LFP recordings were obtained from S1 and M1, and a whole-cell voltage recording from a striatal MSN in the same hemisphere. The dashed line indicates the contralateral whisker stimulation. (C) Waveform average of responses to contralateral whisker deflection (>40 repetitions) for the recordings showed in B. Average responses in S1 and M1 for onset delay (D), peak delay (E), amplitude (F), and slope (G), N = 7. Asterisks *, **, *** represent P values <0.05, <0.01, <0.001, respectively.

