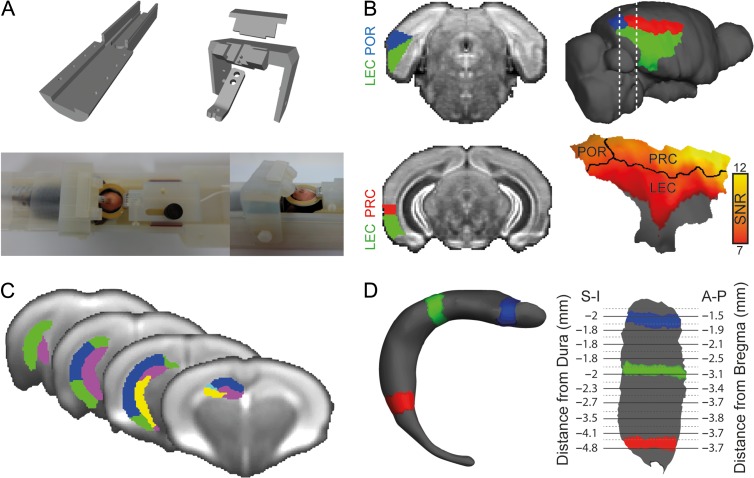
Figure 1.
Visualization of fMRI results in mice. (A) Experimental setup for awake mouse fMRI: custom-made 3D-printed cradle for fMRI in awake head-fixed mice (top); a head-fixed mouse is shown in the cradle with a 20 mm receive-only loop-coil located above the head (bottom). (B) Segmentation of the mouse parahippocampal region in the AMBC Atlas (left) and on a surface reconstruction of the mouse cortex (right). SNR map of the parahippocampal region is presented on the surface reconstruction showing high SNR in the PRC and POR, and attenuated SNR in the LEC due to susceptibility artifacts originating from the air–tissue interface near the ear canals. (C) AMBC Atlas derived segmentation of the hippocampus into subfields overlaid on the group average BOLD SE-EPI upsampled to 100 μm isotropic resolution. (D) Three-dimensional surface reconstruction of the right dentate gyrus (left) and flattened surface representation of the right dentate gyrus (right); colored segments show the relationships between the surfaces. Coordinates in the Atlas space are provided for the flattened representation, superior–inferior (S-I) relative to the dura and anterior–posterior (A-P) relative to bregma.

