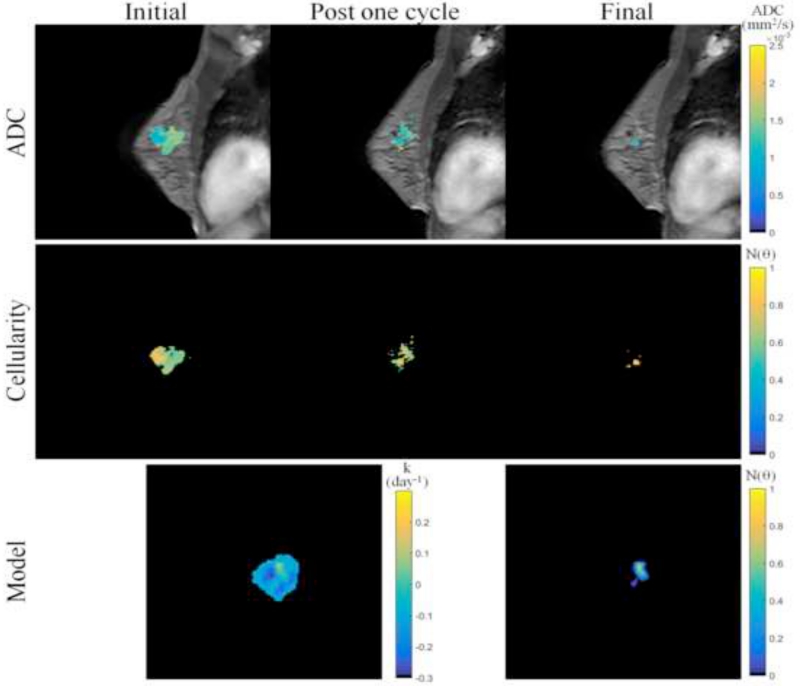
Figure 3.
MR imaging data and mathematical model prediction results for a patient achieving a pathological complete response at the completion of NAT. ADC data at the initial, post one NAT cycle, and final time points (top row) is converted to estimates of tumor cellularity (middle row) using Eq. (21). Global diffusion and spatial proliferation (bottom row, left) model parameters are estimated and the model is used to predict tumor cellularity at the final time point (bottom row, right) and compared to data observations. Though the patient was evaluated at surgery as having achieved a pathological complete response, the imaging data and model predictions at the final time point reflect a very small focal residual tumor. (Note that although we performed a volumetric analysis, for visualization purposes, this figure displays data and results at the central slice of the tumor; see Figures 4 and 7 for volumetric renderings.)

