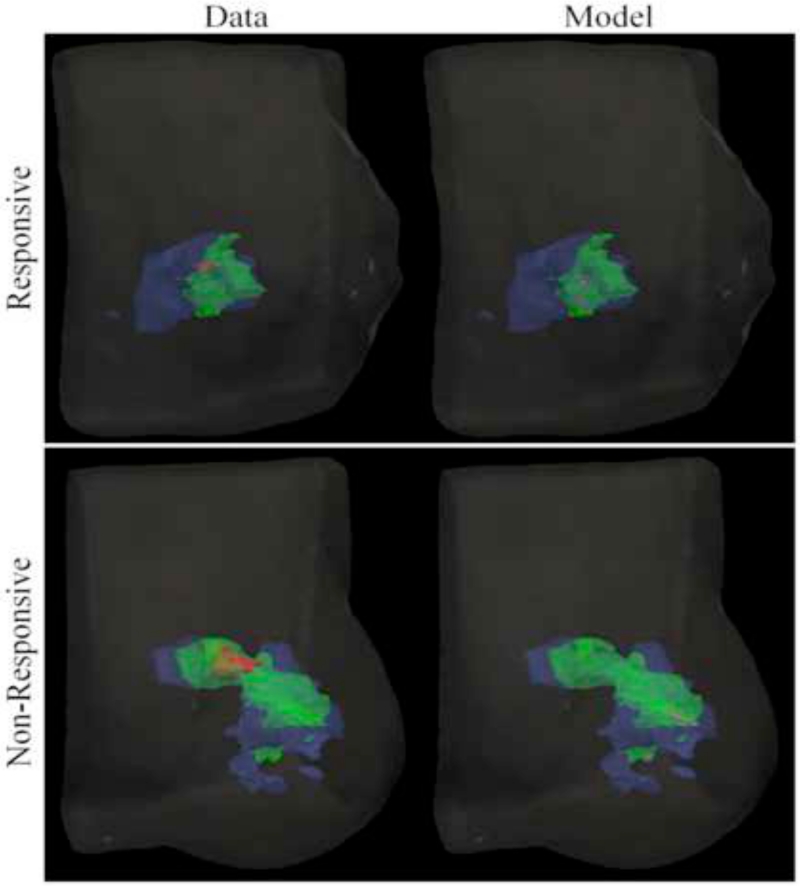
Figure 7.
Merged volumetric renderings of the tumor cell volumes taken from imaging data and model predictions are smoothed and displayed within the breast volume for patients with pCR and non-pCR tumors. Data is collected at the initial (blue), post one NAT cycle (green), and final (red) time points. The model is calibrated using data at the initial and post one NAT cycle time points and used to predict the residual tumor burden at the final time point (purple).

