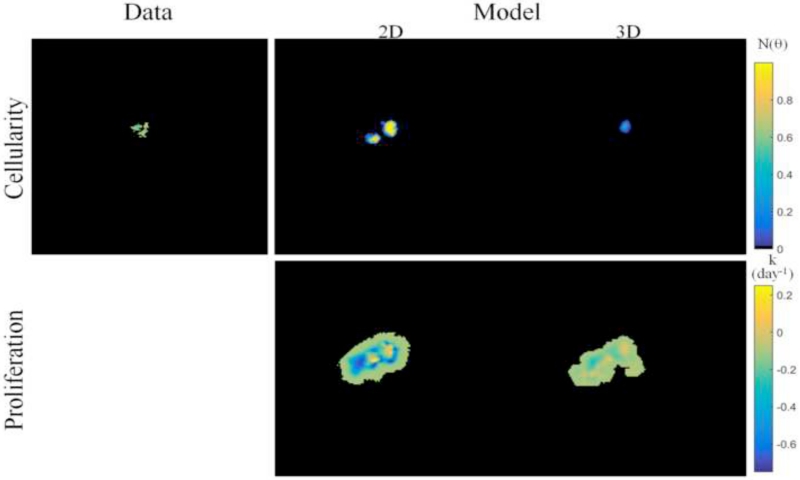
Figure 8.
Comparison of two-dimensional (from prior work) to three-dimensional image-based mathematical model prediction results for a patient with residual tumor burden at the completion of NAT. For two-dimensional model prediction, ADC-based estimates of tumor cellularity at the central imaging slice, as shown in Figure 5, are used to calibrate the model and predict residual tumor burden. Tumor cellularity at the final time point (top row) are shown for imaging data, two-dimensional model prediction, and three-dimensional model prediction (at the central imaging slice) and reflect that three-dimensional model prediction is seen to more closely match imaging data observations than the two-dimensional model. Spatial proliferation maps (bottom row) reflect differences in estimated model parameters for each model. (Note that although we performed a full volumetric analysis for the three-dimensional model, for comparisons to the two-dimensional case, this figure displays results at the central slice of the tumor.)

