
Figure 4. WNT inhibition promotes proliferation of interstitial αSMA negative cells in the infarcted heart.
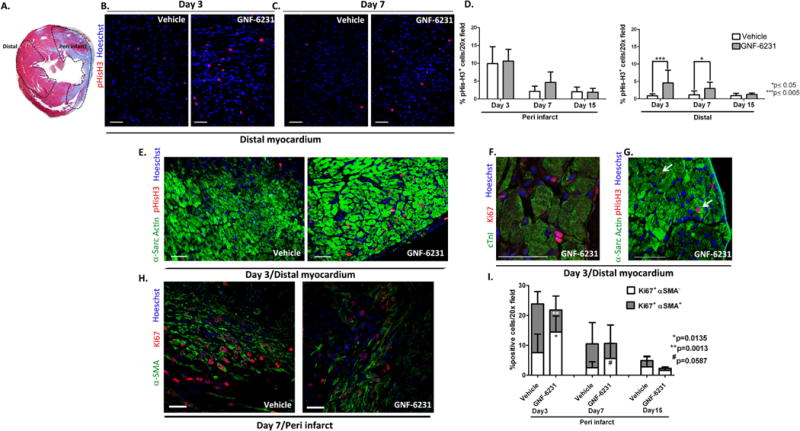
(A) H&E stained cross-section of the heart demarcating peri-infarct and distal regions of the left ventricle as defined in the study. Representative pHisH3 stained sections of the ventricles at (B) day 3 and (C) day 7 showing more proliferative cells in the distal myocardium of GNF-6231 treated hearts. (D) Quantification of percent pHisH3+ cells. Bars represent mean ± SD; N ≥ 4 images of sections from N ≥ 3 mice per group were imaged; *p ≤ 0.05, ***p ≤ 0.005; One-Way ANOVA with Bonferroni Correction for multiple comparisons. Representative sections of the distal myocardium at day 3 post-MI (E) co-stained with αSarcomeric Actin and pHisH3, and (F) high magnification confocal microscopy image of ventricle co-stained with cTnI and Ki67, demonstrating that the majority of proliferative cells in the GNF-6231-treated tissue localized to the interstitium of myofibers. (G) αSarcomeric Actin/pHisH3 co-stained LV depicting the rare proliferating cardiomyocytes (white arrows). (H) Proliferating myofibroblasts were identified by αSMA/Ki67 co-staining as depicted in the representative section from the peri-infarct region at day 7. (I) Quantification of αSMA/Ki67 co-stained cells revealed that the percentage of proliferating myofibroblasts (grey shaded portion of the bars) was significantly lower in GNF-6231-treated peri-infarct tissue than control at day 3 (**p=0.0013) and lower (#p=0.0587) at day 7. In contrast, the percentage of proliferating non-myofibroblasts (αSMA− cells; lower white portion of the graphs) was significantly higher (*p=0.0135) in GNF-6231 treated ventricles compared to control at day 7. Bars represent mean ± SD. N ≥ 12: at least 3 separate sections from at least 3 mice per group were imaged. P-values for individual comparisons between each two groups of data were calculated using Mann-Whitney test. Scale bars equal 50 μm.