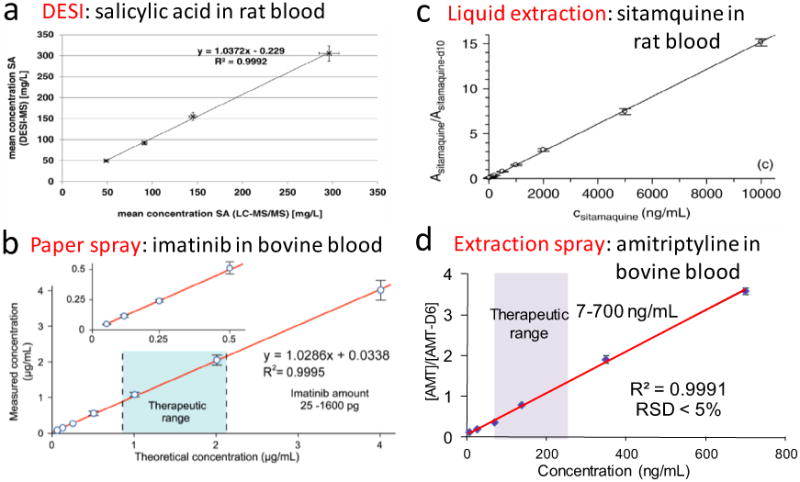
Fig. 3.

Quantitative analysis by ambient ionization-MS. (a) Good correlation between DESI-MS and LC-MS/MS quantitative results of SA in rat DBS using the three-layer setup (Reprinted with permission from [44], Elsevier) (b) Calibration curve of sitamaquine in rat blood (10–10, 000 ng/ml) using 570 ng/ml sitamaquine-d10 as the IS. (Reprinted with permission from [45], Wiley) (c) Calibration curve for the analysis of sitamaquine in rat blood by liquid extraction-based surface sampling and ionization using sitamaquine-d10 as the IS. (Reprinted with permission from [45], Wiley) (d) Calibration curve for analysis of amitriptyline in blood samples using extraction spray, MRM transition m/z 277 to 223 for amitriptyline and m/z 283 to 223 for internal standard amitriptyline-d6 (200 ng/mL), 0.2 μL blood used for DBS, 10 μL methanol for extraction and spray. (Adapted with permission from [46], The Royal Society of Chemistry).
