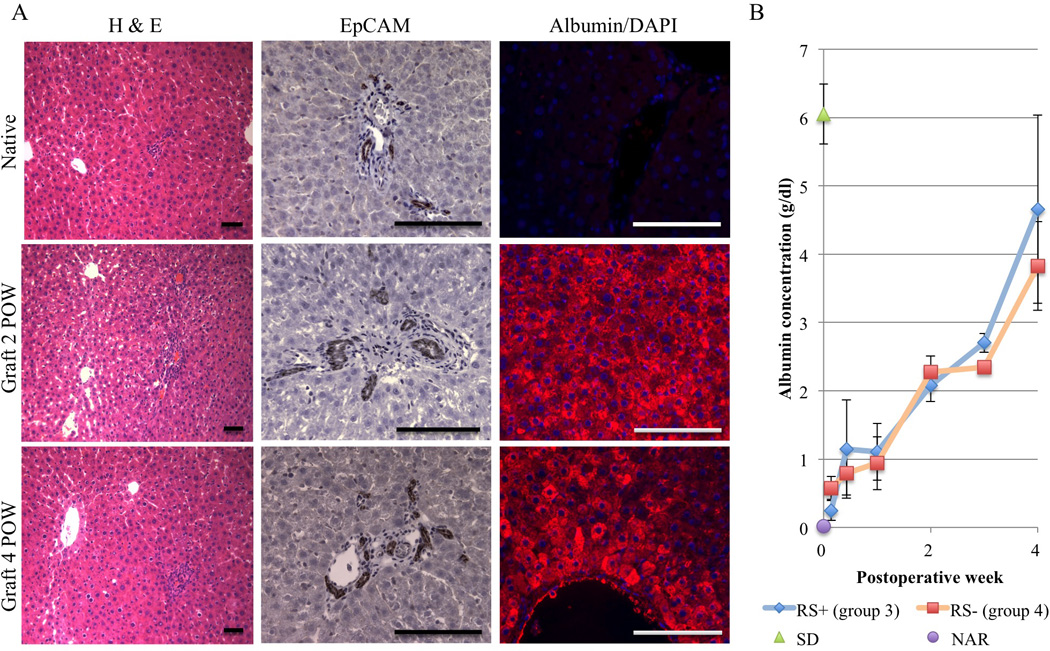
Figure 2. Histological appearance of liver graft and assessment of graft function.

(A) H & E staining and immunohistochemical analyses of EpCAM and albumin expression in NAR native liver as a control and in the liver graft at 2 and 4 postoperative weeks (POW; representatives of groups 1 and 3). Scale bar = 50 µm. (B) Time course of serum albumin levels determined by ELISA in NAR recipient rats with normal SD grafts. Data show post-transplant RS+ NAR (group 3; n = 3) and RS− NAR (group 4; n = 3) albumin levels over time. As controls normal SD (n = 3) and NAR (n = 3) albumin levels are also shown at 0 POW. Values are shown as means ± SEM.
