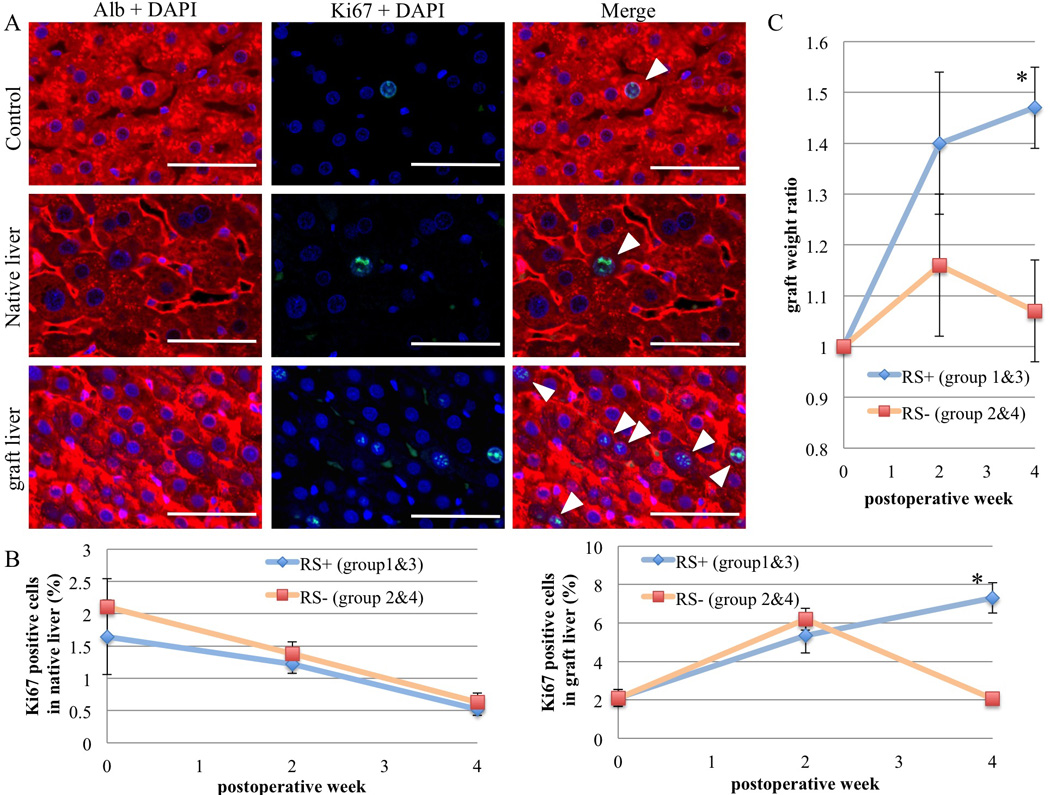
Figure 3. Assessment of the regenerative capacity of the transplanted liver in RS-treated (group 1 and 3) versus non RS-treated recipients (group 2 and 4).

(A) Ki67/Albumin co-immunofluorescence staining in the graft and native liver with RS treatment 2 weeks after APLT. White arrowheads indicate Ki67+ cells. Scale bars = 50 µm. (B) To assess proliferation, Ki67 positive and negative hepatocytes were counted in 5 high power fields of each group at ×400 magnification and positive hepatocytes expressed as a percentage of total hepatocytes. (C) “Graft weight ratio” at 2 and 4 weeks after APLT comparing the RS and non RS-treated groups. Values are means ± SEM. *, P ≤ 0.05.
