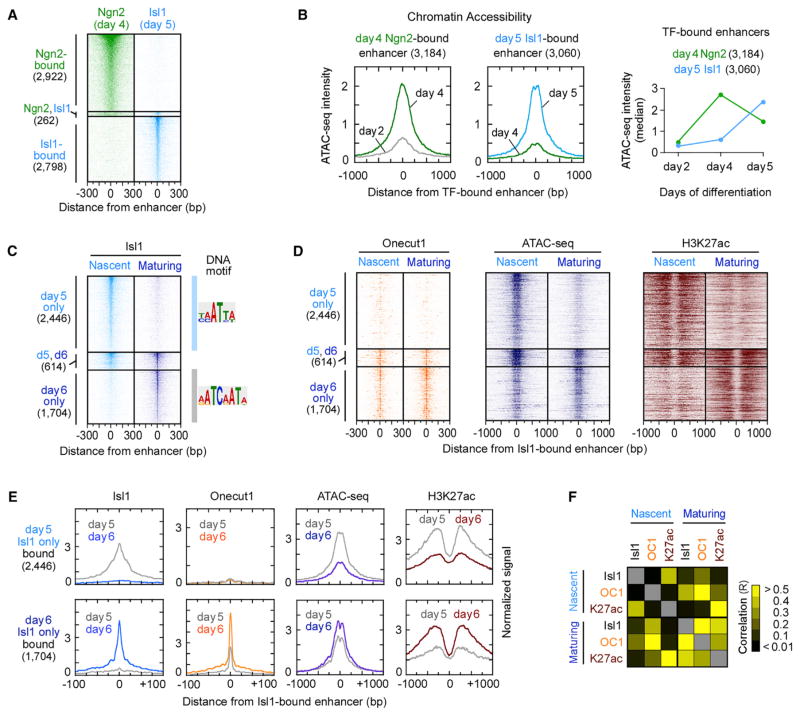
Figure 2. Ephemeral Nature of Enhancers Established by Motor Neuron Programming TFs.
(A) ChIP mapping of Ngn2-bound enhancers in day 4 progenitors and Isl1-bound enhancers in day 5 postmitotic MNs, sorted by TF occupancy. Ngn2 and Isl1 TFs were found within 1 kb genomic region only in 262 locations.
(B) Composite (average read counts) plots of days 2 and 4 ATAC-seq intensity for Ngn2-bound enhancers (left) and days 4 and 5 ATAC-seq intensity for Isl1-bound enhancers (middle) (Figure S2A). Right panel depicts a transient increase in median ATAC-seq intensity of Ngn2-bound enhancers on day 4 and a gain of chromatin accessibility of Isl1-bound enhancers on day 5, coincident with the time of TF expression.
(C and D) ChIP intensity of Isl1 (C), Onecut1, and H3K27ac and ATAC-seq (D) measured in nascent (day 5) and maturing (day 6) postmitotic MNs. All data are plotted relative to the Isl1-bound enhancer midpoints (Table S2), sorted and ordered by Isl1 occupancy. If the midpoints between day 5 and day 6 Isl1-bound enhancers reside within 1 kb, they were defined as maintained enhancers (n = 614). DNA motif represents the most enriched sequence within ±14 bp from the midpoint of Isl1-bound site (Figure S2B).
(E) Composite plots of (C) and (D).
(F) A heatmap of Pearson correlation coefficients (R) for pairwise combinations of TFs and H3K27ac intensity, shown in (C) and (D) (Table S3).
See also Figure S2.

