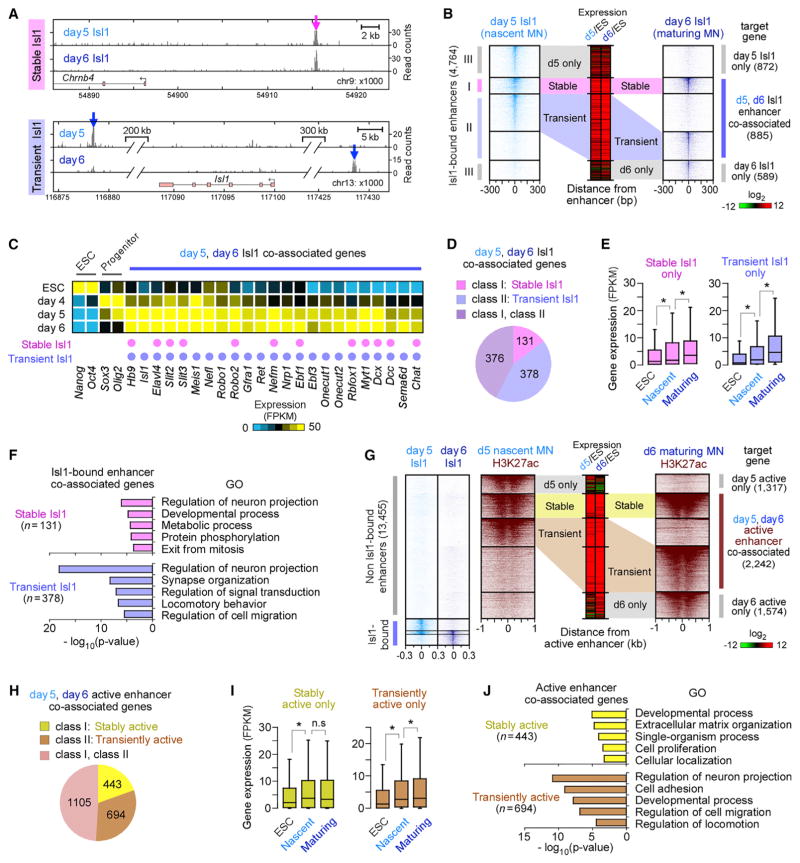
Figure 3. Motor Neuron Effector Genes Are Associated with Stage-Specific Isl1-Bound Enhancers.
(A) Examples of a stable Isl1-bound enhancer (class I, magenta) proximal to Chrnb4 and transient enhancers (class II, blue) proximal to Isl1 gene in nascent (day 5) and maturing (day 6) MNs. ChIP mapping of Isl1 is shown.
(B) Isl1 occupancy relative to Isl1-bound enhancers, sorted and ordered by Isl1 occupancy. These enhancers were grouped by the presence of stable (I), transient (II), day 5 only (III), and day 6 only (III) Isl1-bound enhancers. Middle panel shows relative changes in associated gene expression in day 5 or day 6 MNs relative to ESCs (Log2 FPKM).
(C) Expression profiles of selected genes developmentally regulated in ESCs, progenitors, and postmitotic MNs. Association of a gene with stable and/or transient enhancers is marked by a pink and purple dot, respectively.
(D) Number of genes associated only with stable, transient, or both classes of Isl1-bound enhancers, shown in (B).
(E) Boxplots of RNA expression on days 0, 5, and 6 for genes associated only with stable enhancers (n = 131) and only with transient enhancers (n = 378), shown in (D) (Table S4). Boxplots show the median (line), second to third quartiles (box), and 1.5× the interquartile range (whiskers). *p < 1 × 10⁻⁸, n.s. non-significant (p > 0.05); Wilcoxon rank-sum test.
(F) Top five non-redundant GO terms of genes shown in (D) (Table S5).
(G) H3K27ac intensity relative to active enhancers (n = 13,455), which were enriched for both H3K27ac and ATAC-seq intensity in the absence of Isl1 binding (subset of groups d, e, f, and g in Figure 1C), sorted and ordered by H3K27ac intensity. These enhancers were grouped by the presence of stable, transient, day 5 only, and day 6 only active enhancers.
(H) Number of genes associated only with stable, transient, or both classes of active enhancers, shown in (G).
(I) Same as in (E), except for genes shown in (H).
(J) Top five non-redundant GO terms of genes shown in (H).
See also Figure S3.

