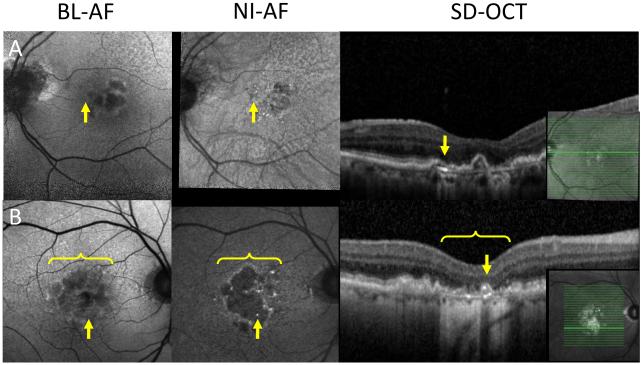
Figure 5.
Calcific drusen on autofluorescence.
A&B: Two subjects with hyper-NIA lesions (middle column, arrow) that do not appear on FAF (left column, arrow). These normal FAF hyper-NIA lesions appear as calcific drusen on SD-OCT (right column, arrow). Panel B also shows a heterogeneous area of hypo BL-AF and normal BL-AF (left column, bracket) with a homogenous well demarcated area of hypo NI-AF indicating geographic atrophy (middle column, bracket) confirmed on OCT (right column, bracket) Inset: location of OCT slab. Inset: location of SD-OCT slab.

